Blog

Marin County Real Estate July 2022 Report

Marin County Real Estate July 2022 Report


Market report on economic headwinds, falling appreciation rates, and Bay Area real estate conditions.


Market report discussing declining Bay Area appreciation rates, economic headwinds, and the difference between a correction and a crash.


Real estate market report discussing Bay Area market trends, seasonality, supply and demand, and mortgage rates.


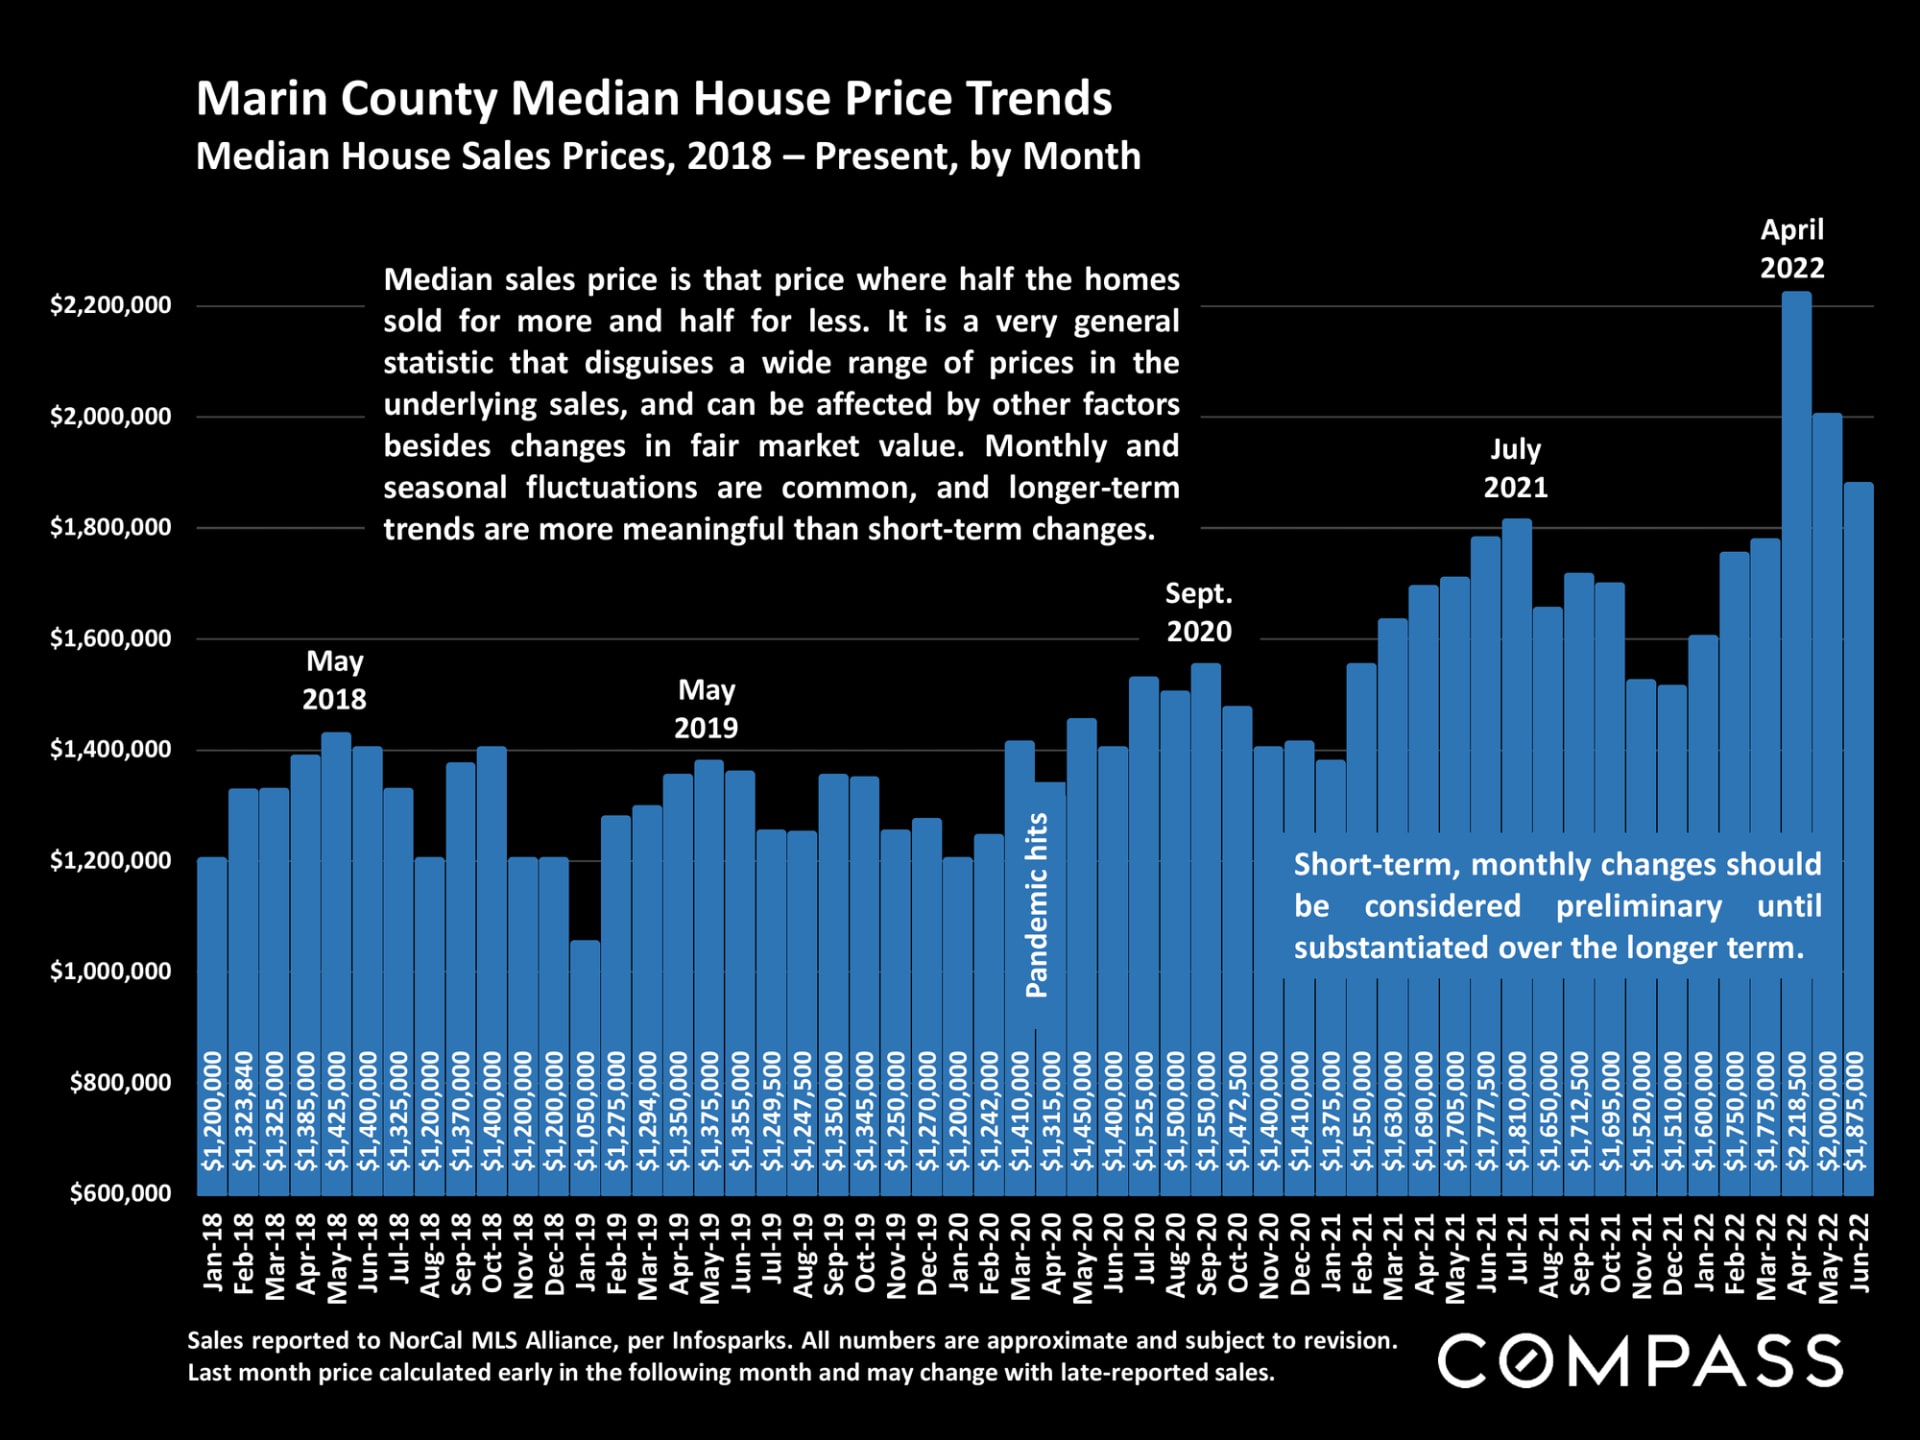
Chart of Marin County median house prices by month, January 2018 to June 2022, peaking above $2.2 million in April 2022.


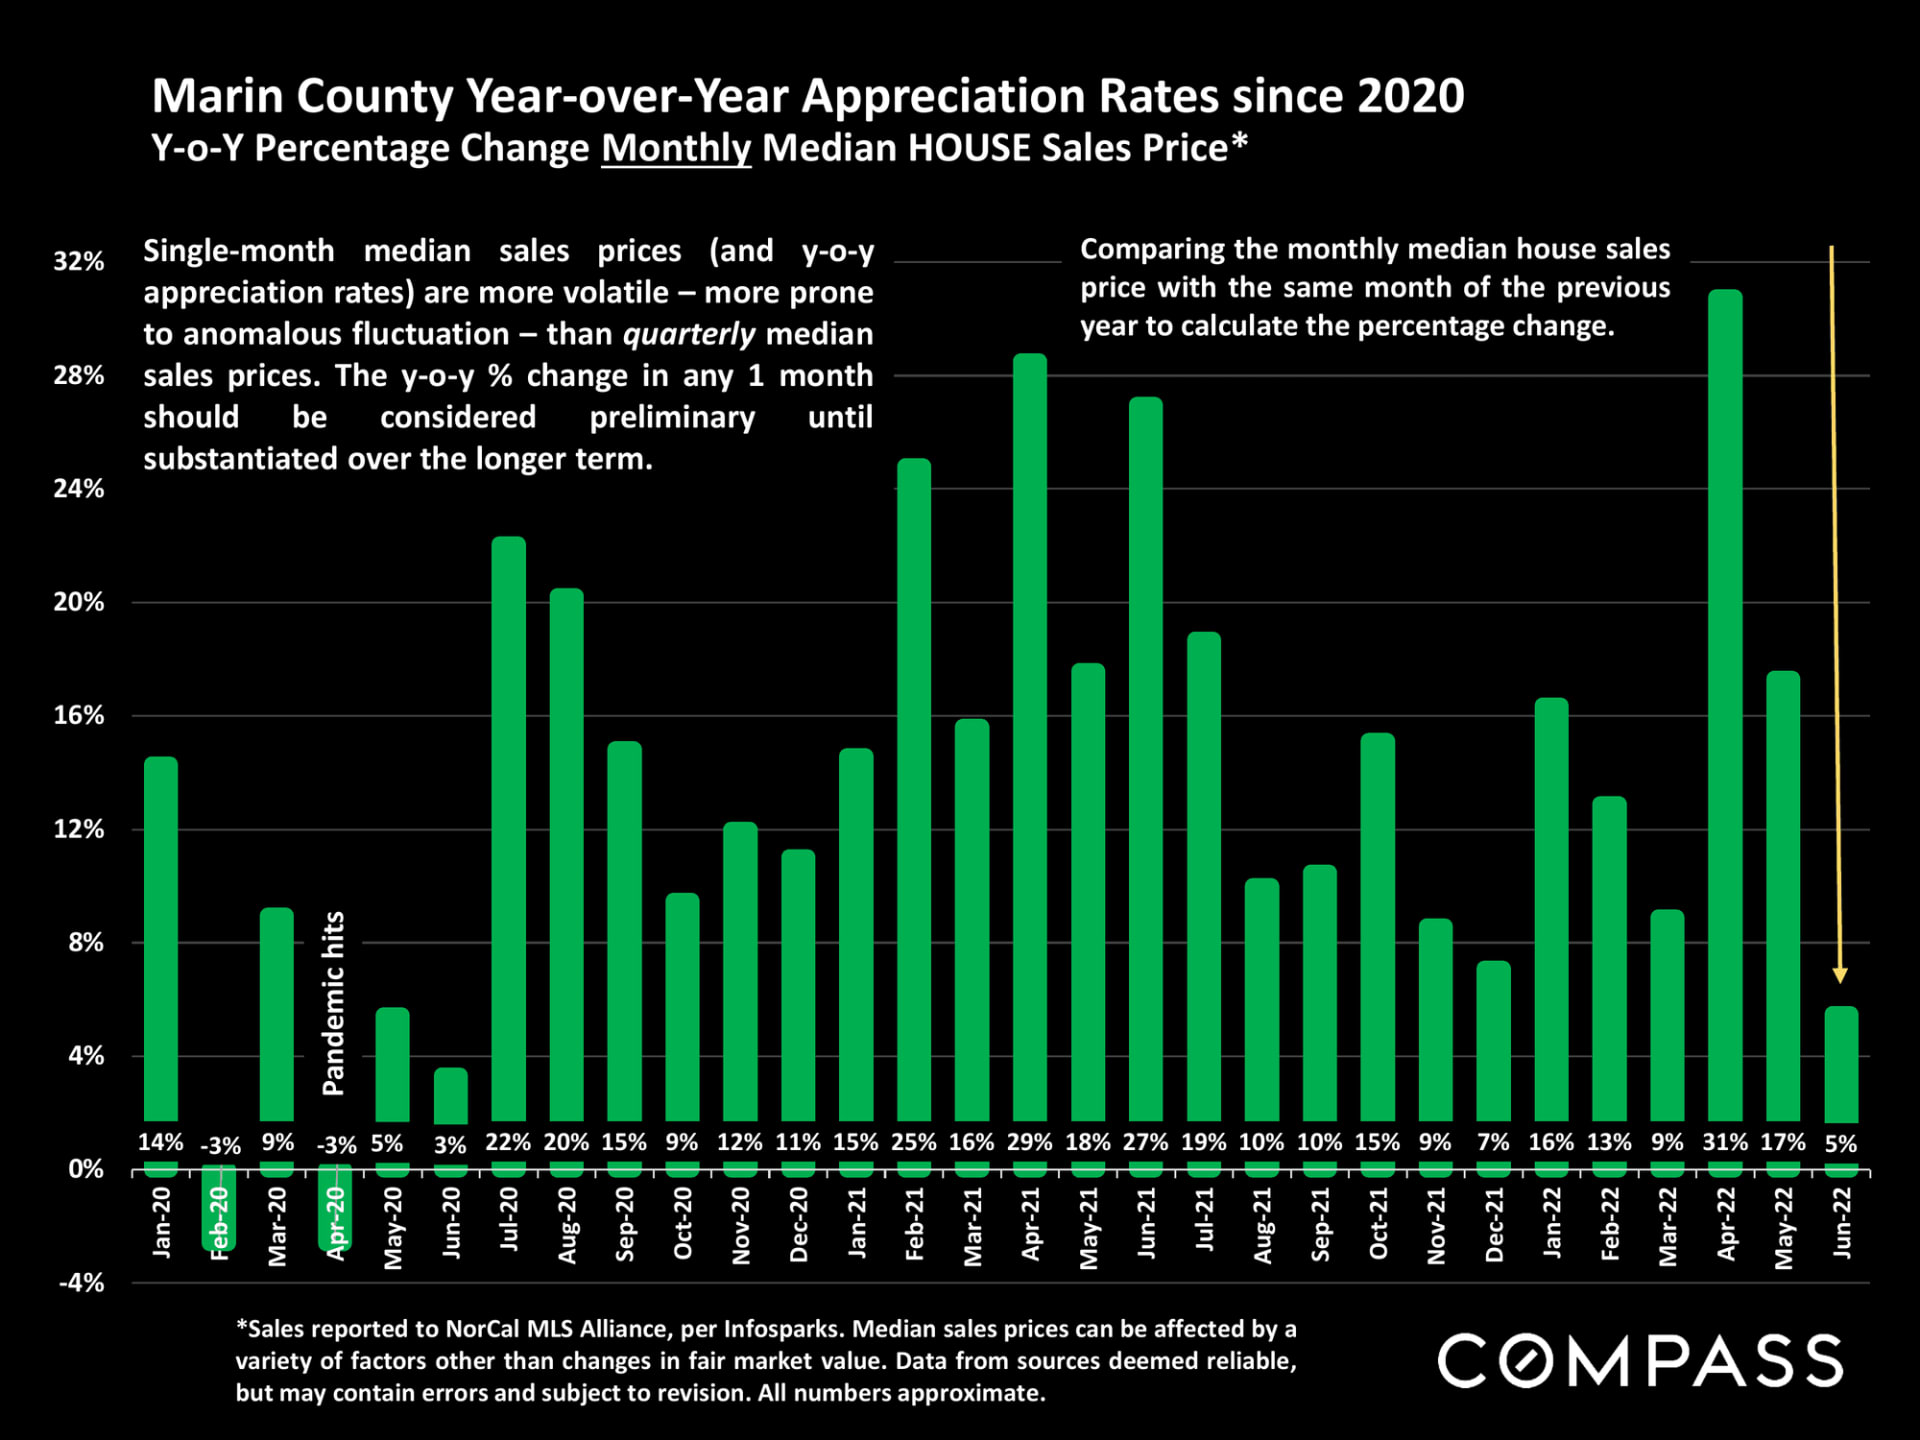
Bar chart of Marin County home-price appreciation rates from January 2020 to June 2022, ending at 5%.


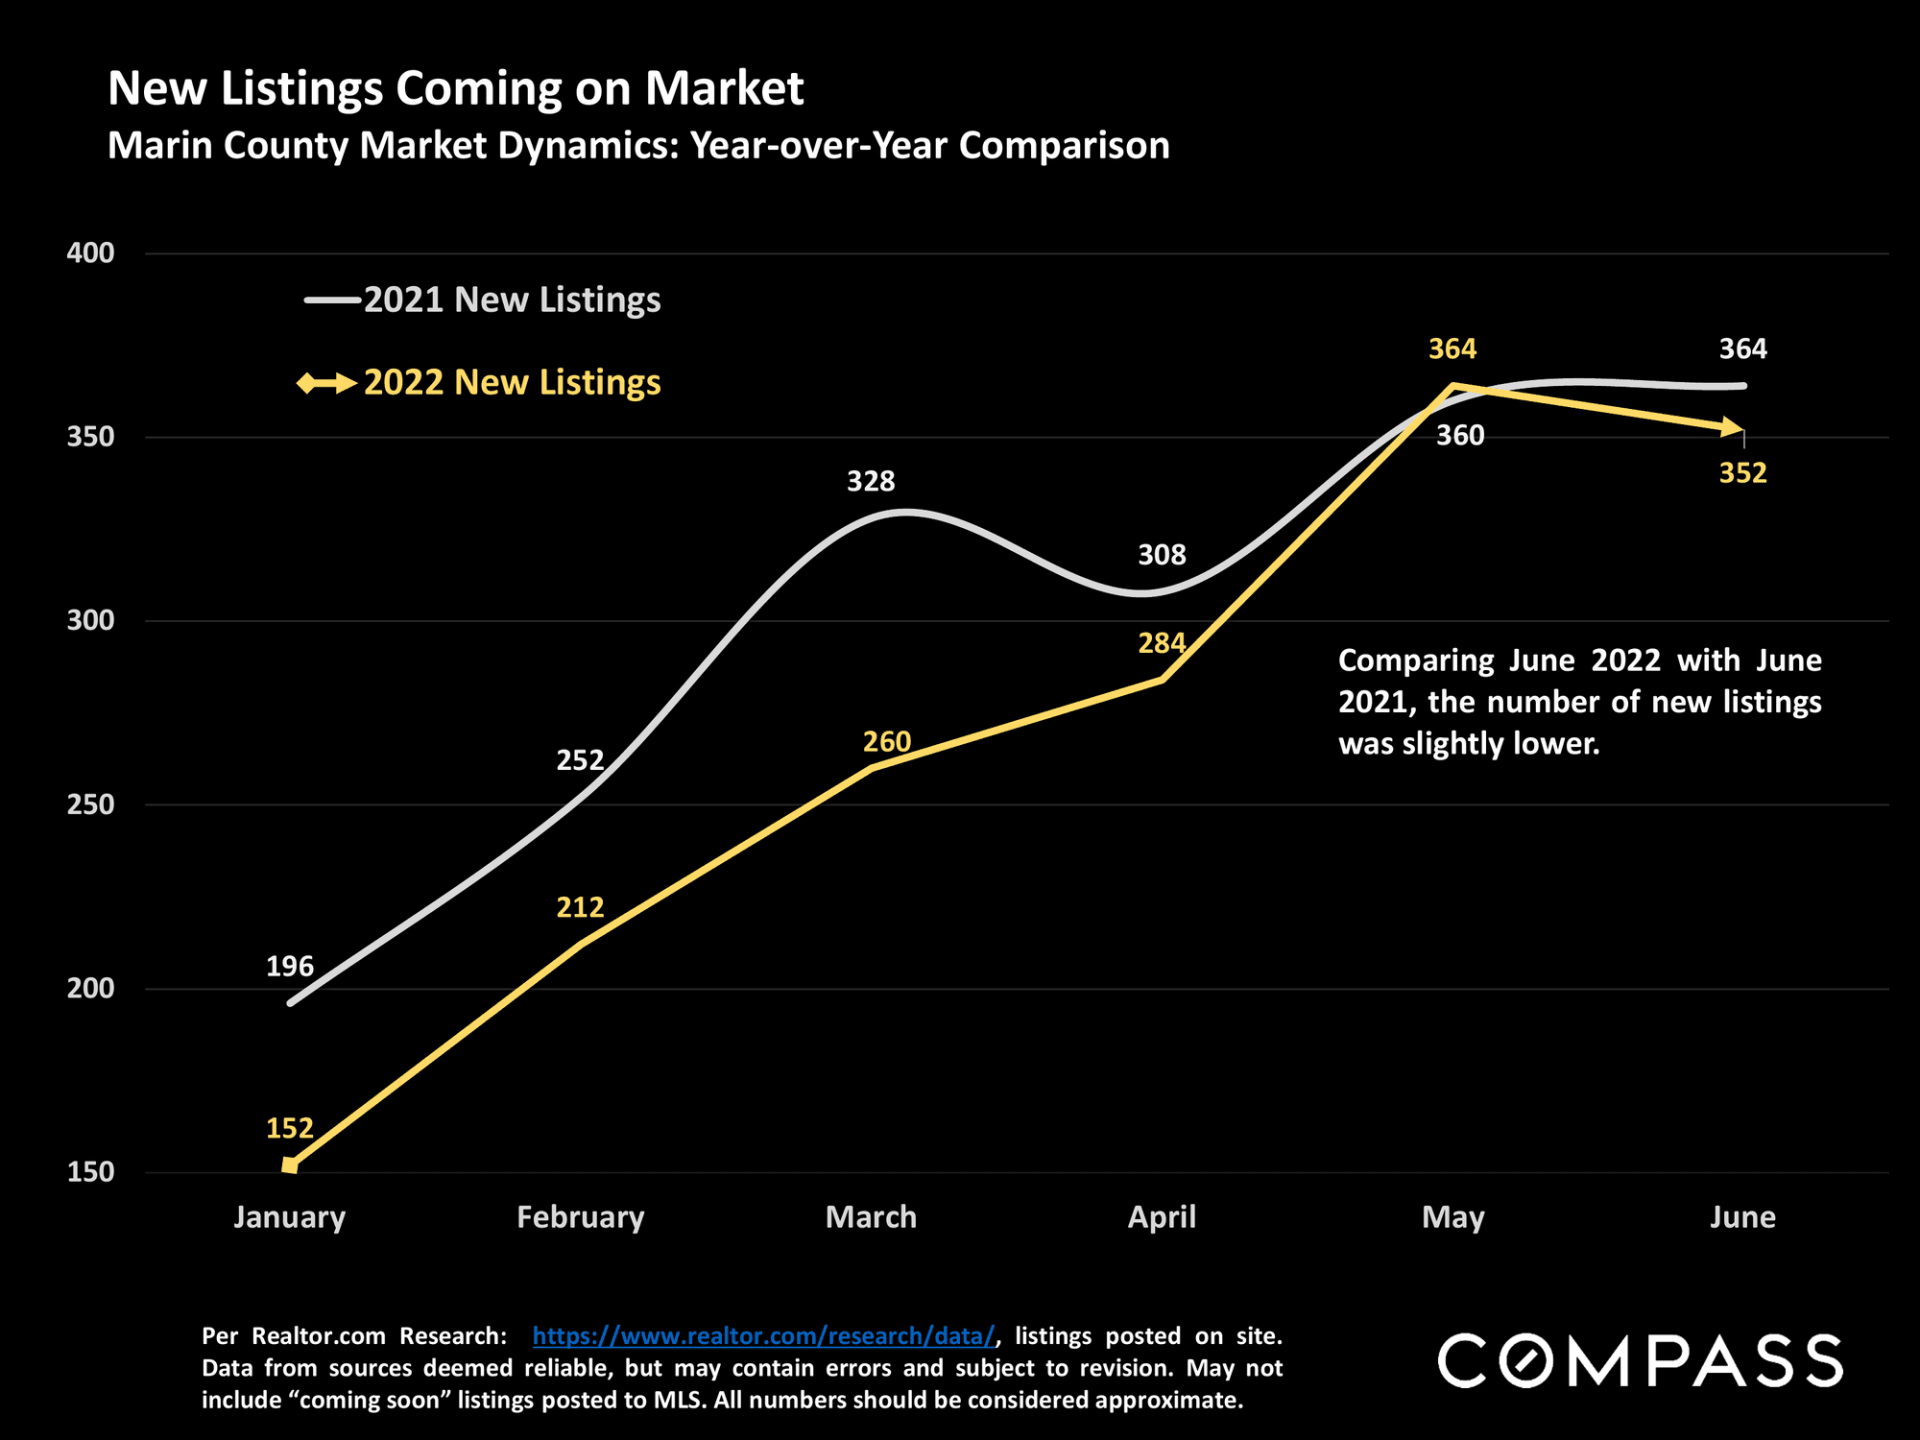
Chart comparing Marin County new listings in 2021 and 2022, with June totals of 364 and 352.


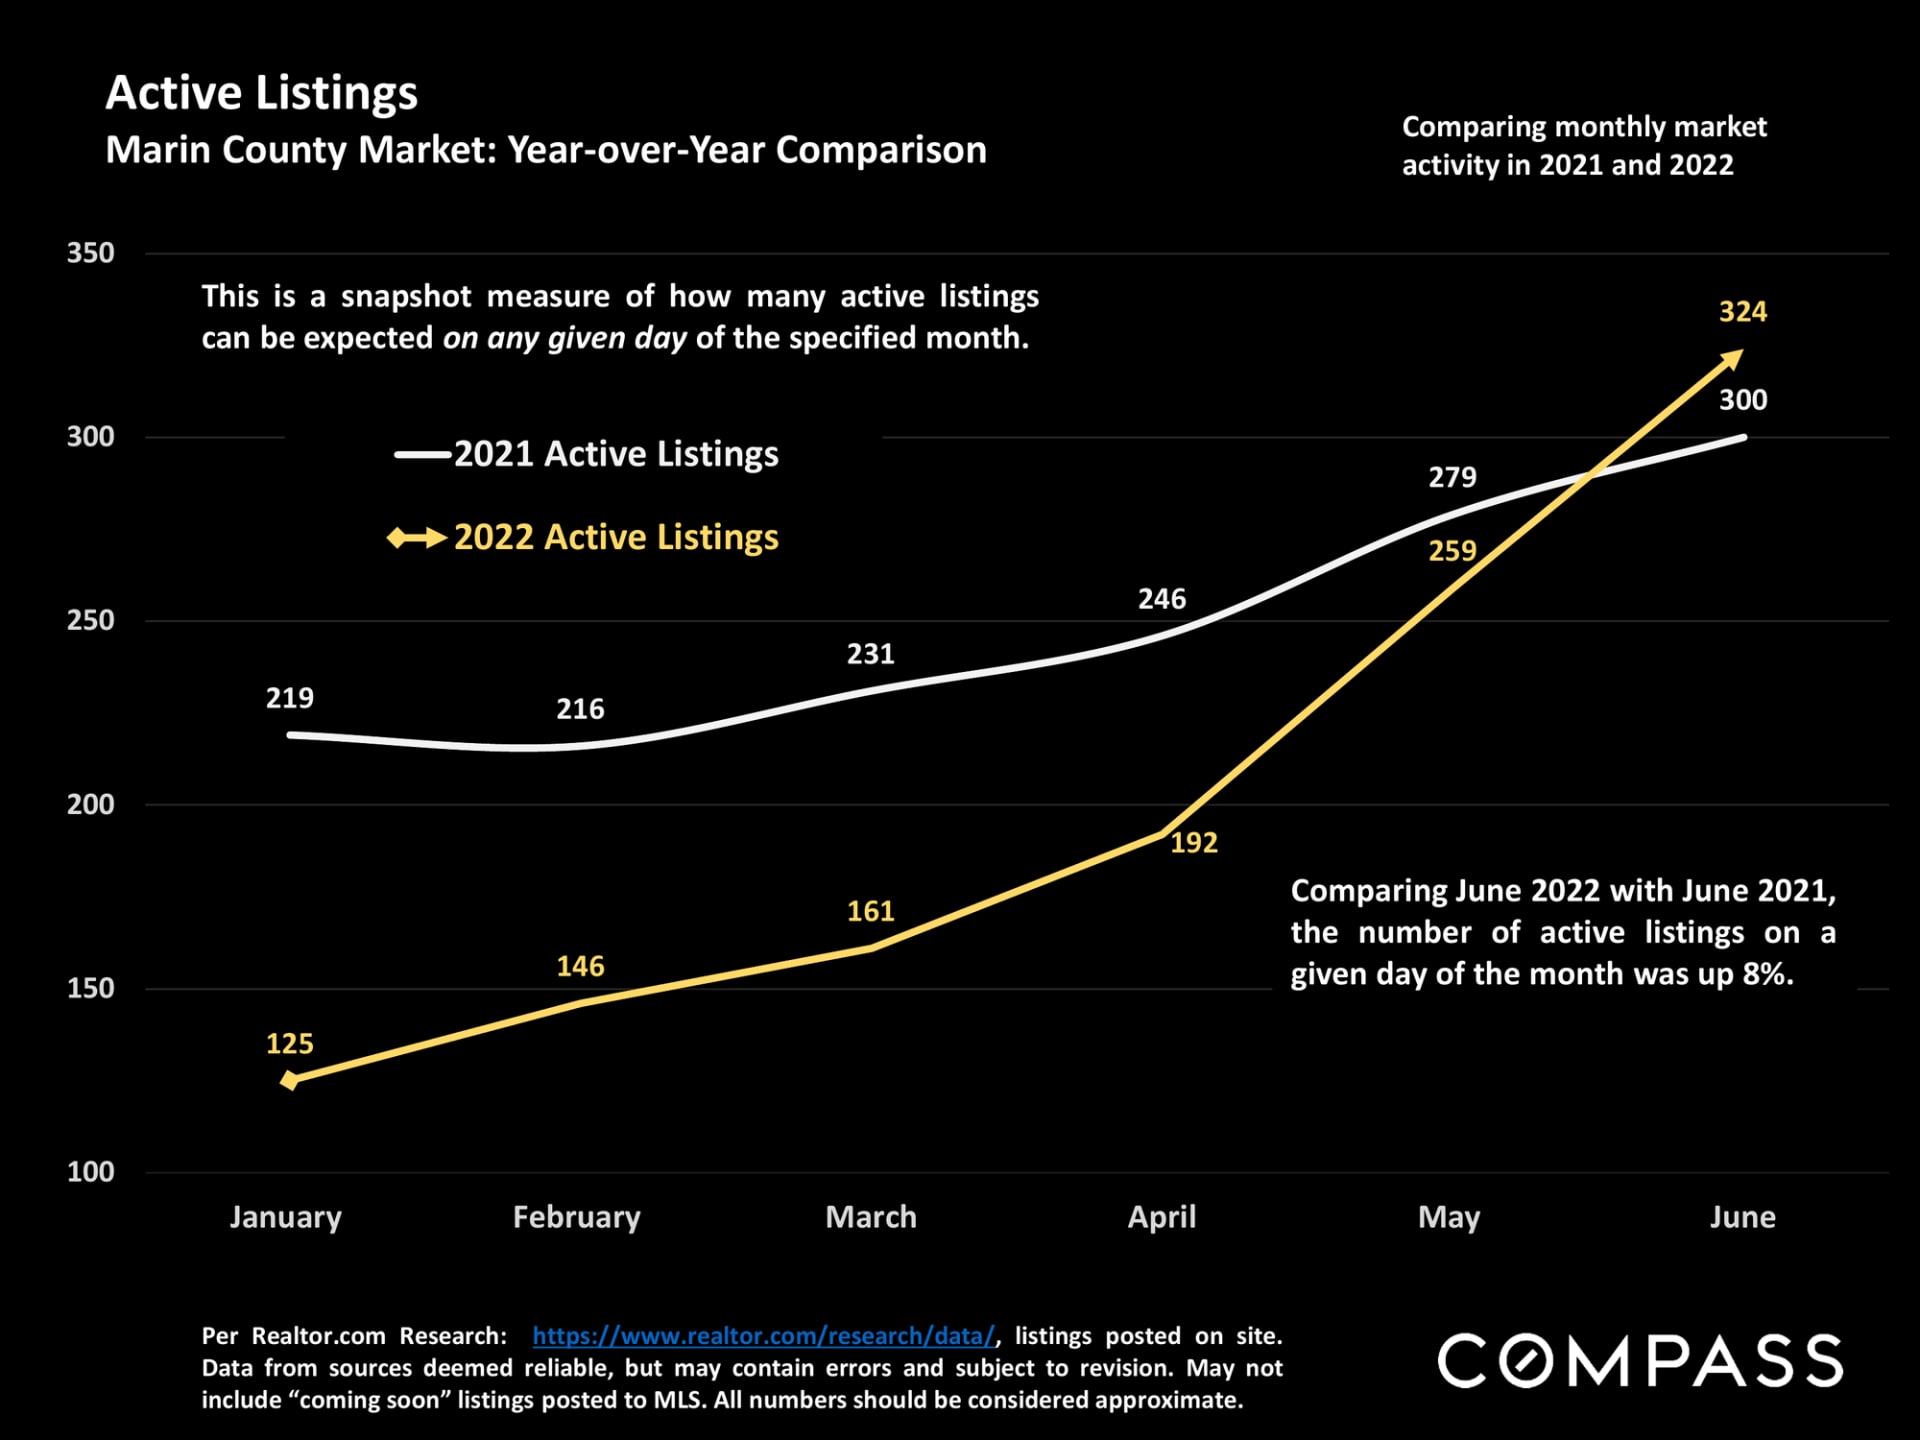
Chart comparing Marin County active listings in 2021 and 2022; June totals are 300 and 324, respectively.


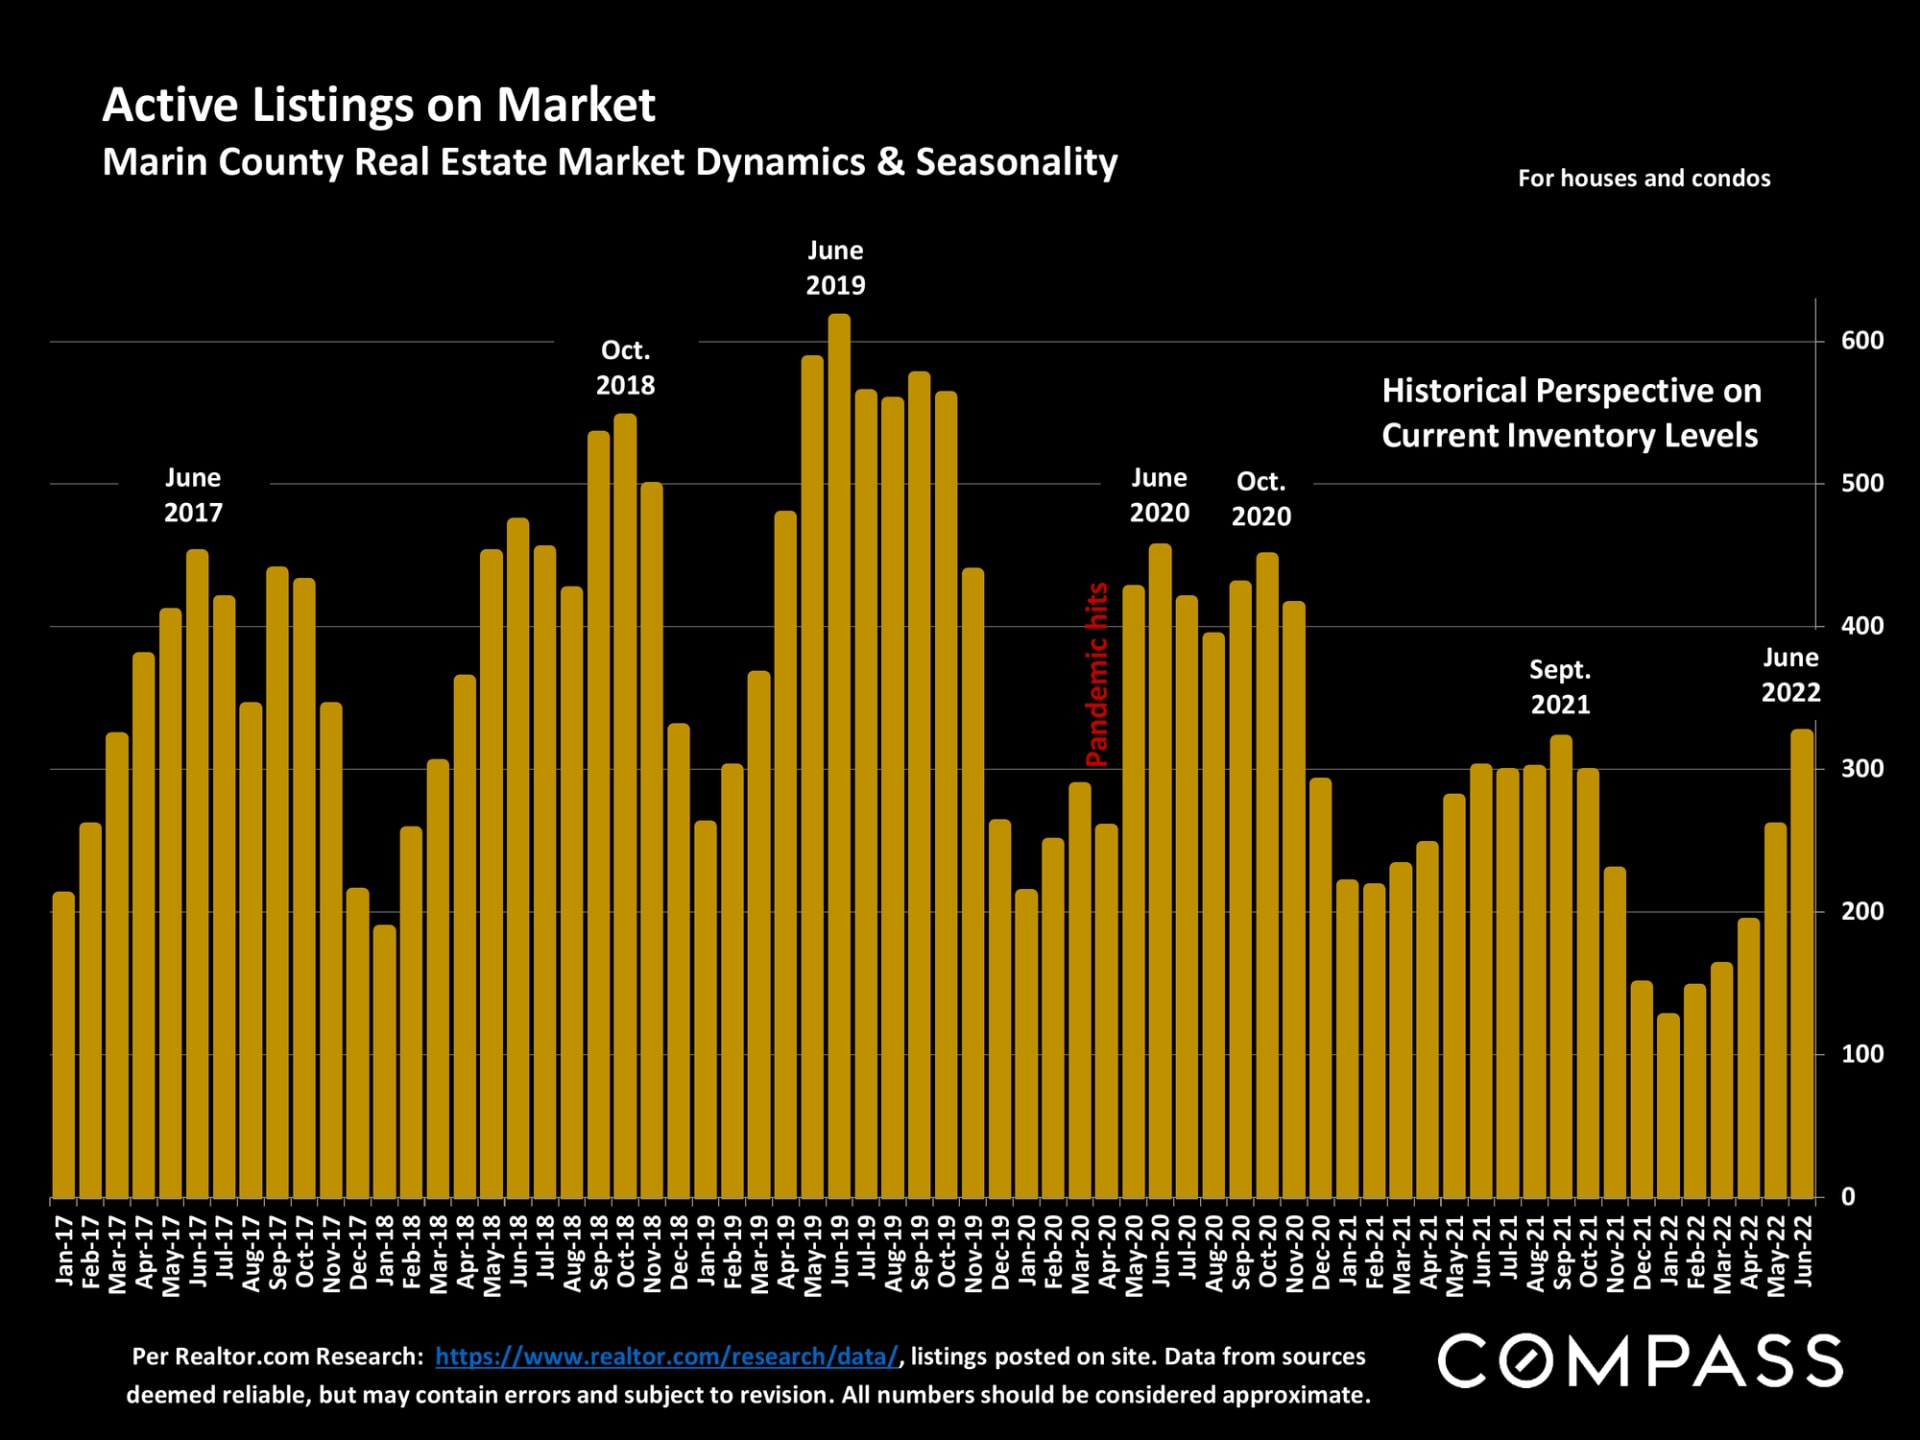
Bar chart of Marin County active listings, January 2017–June 2022, with gold bars and a June 2022 total near 330.


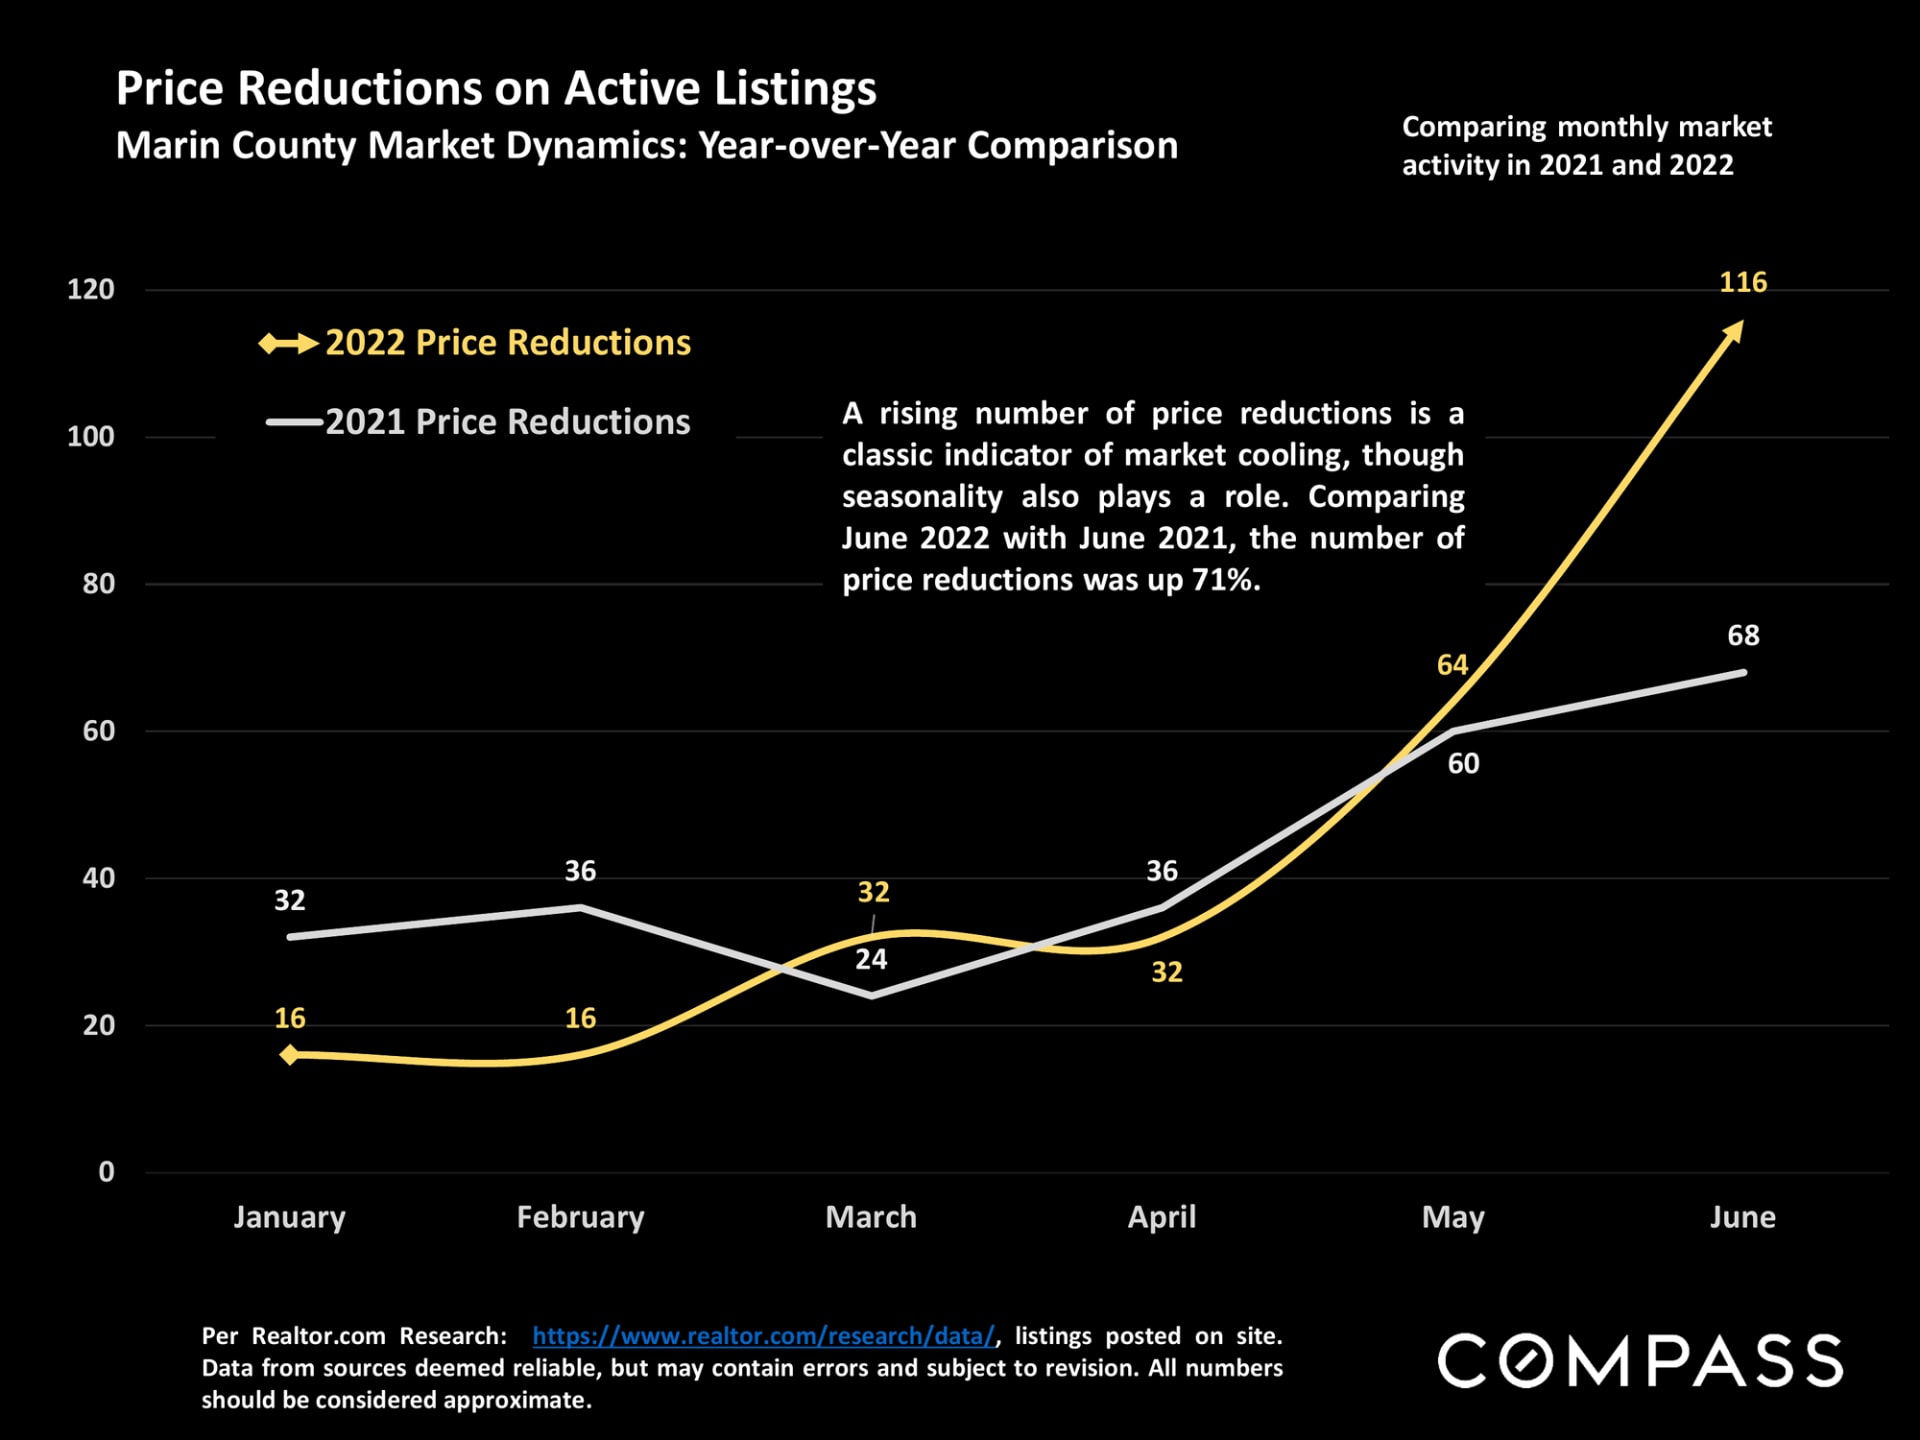
Line chart comparing monthly Marin County active-listing price reductions in 2021 and 2022, January through June.


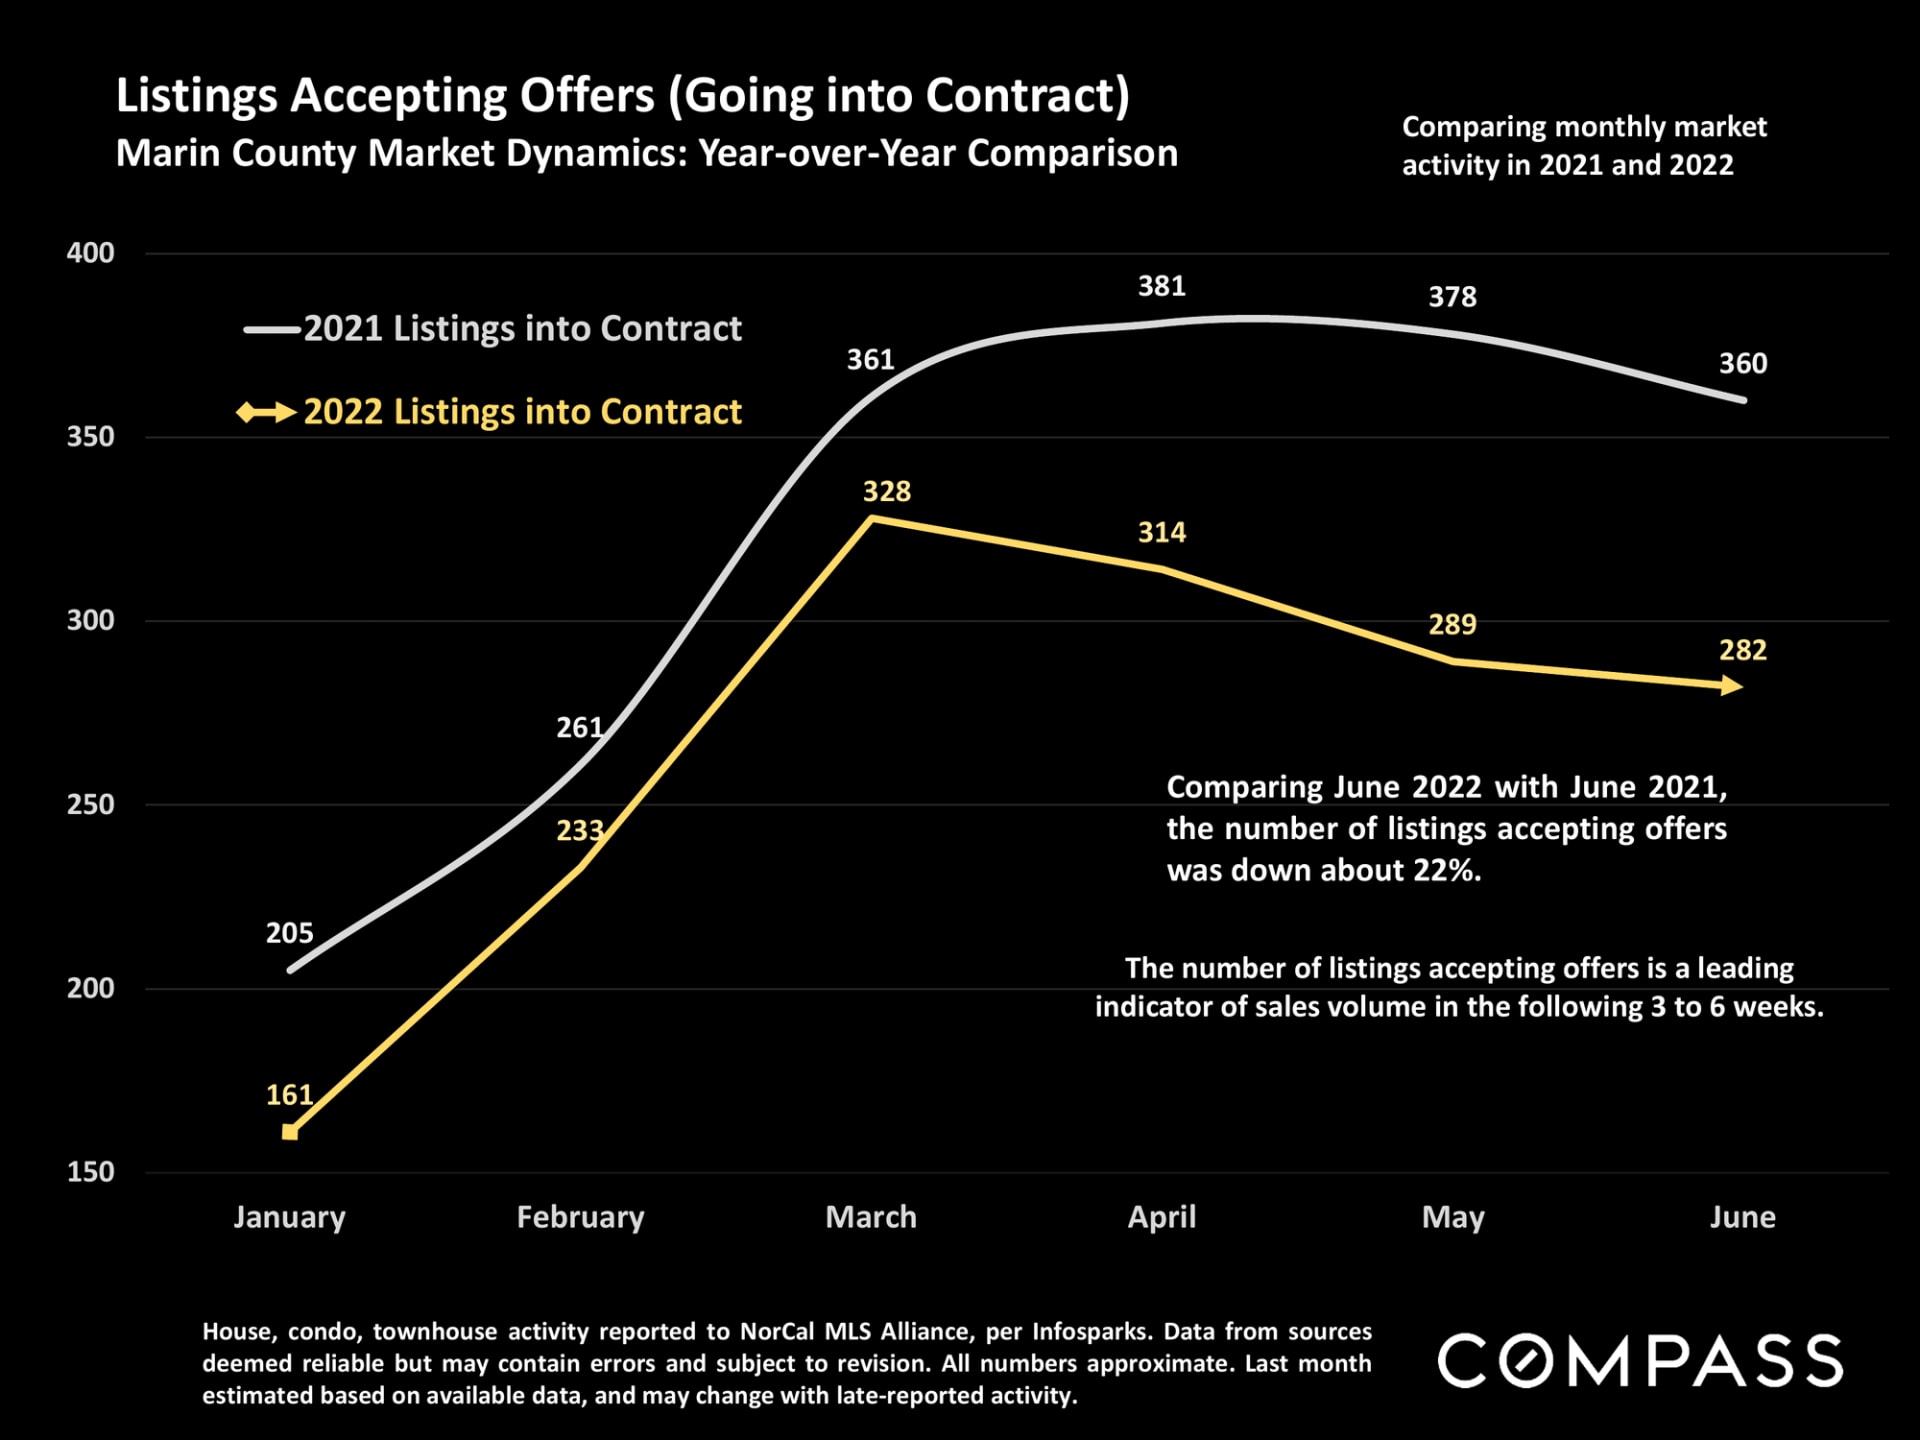
Marin County chart compares monthly listings going into contract in 2021 and 2022, with 2022 values below 2021.


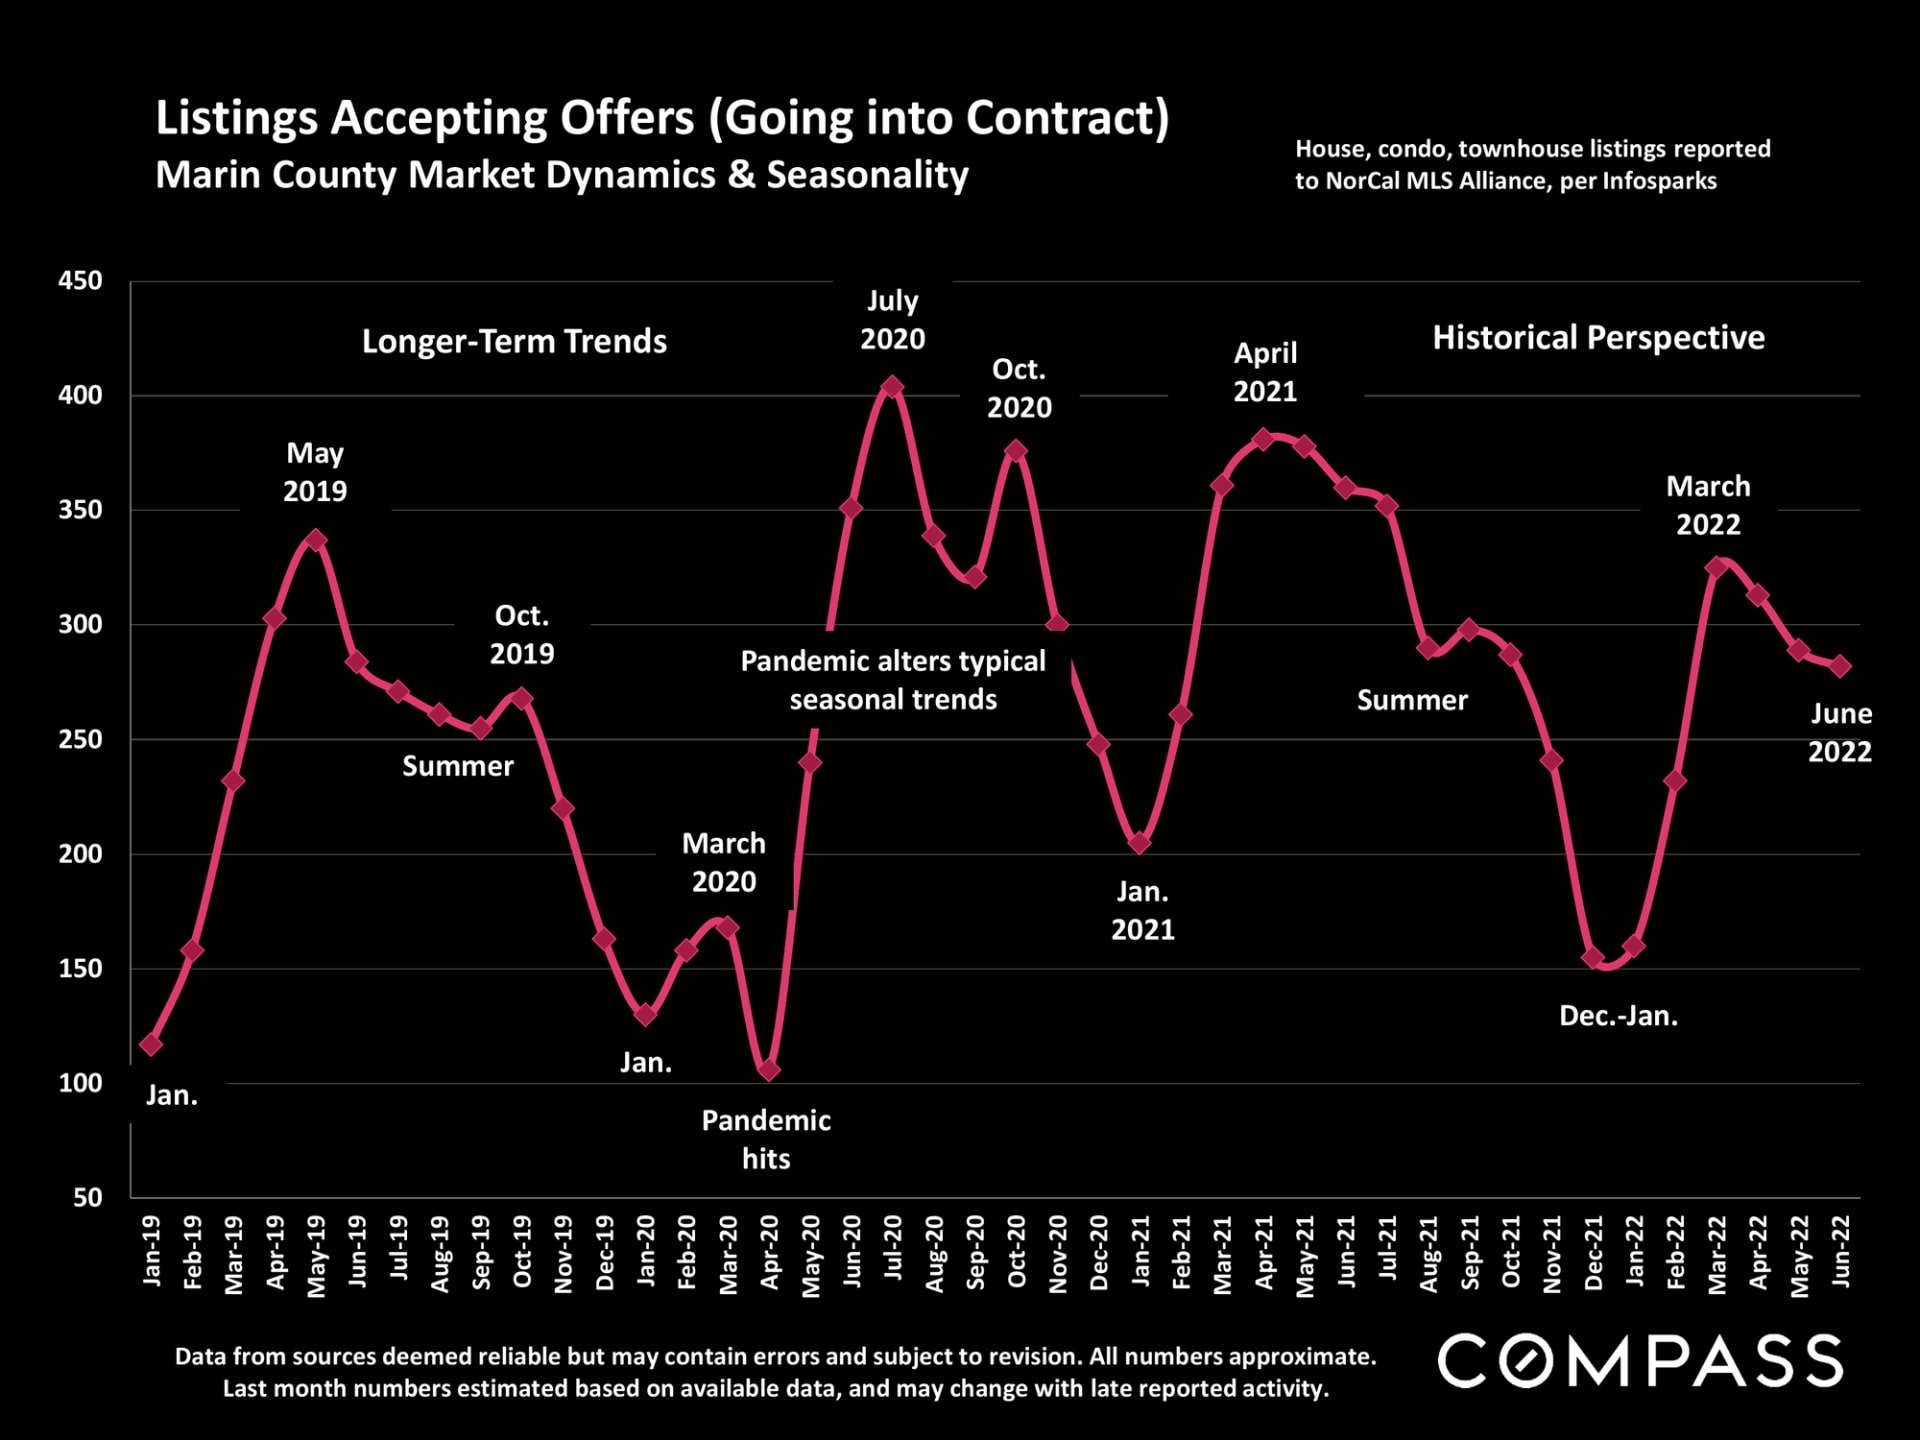
Chart of Marin County listings accepting offers from January 2019 to June 2022, with pandemic-era seasonal trends annotated.


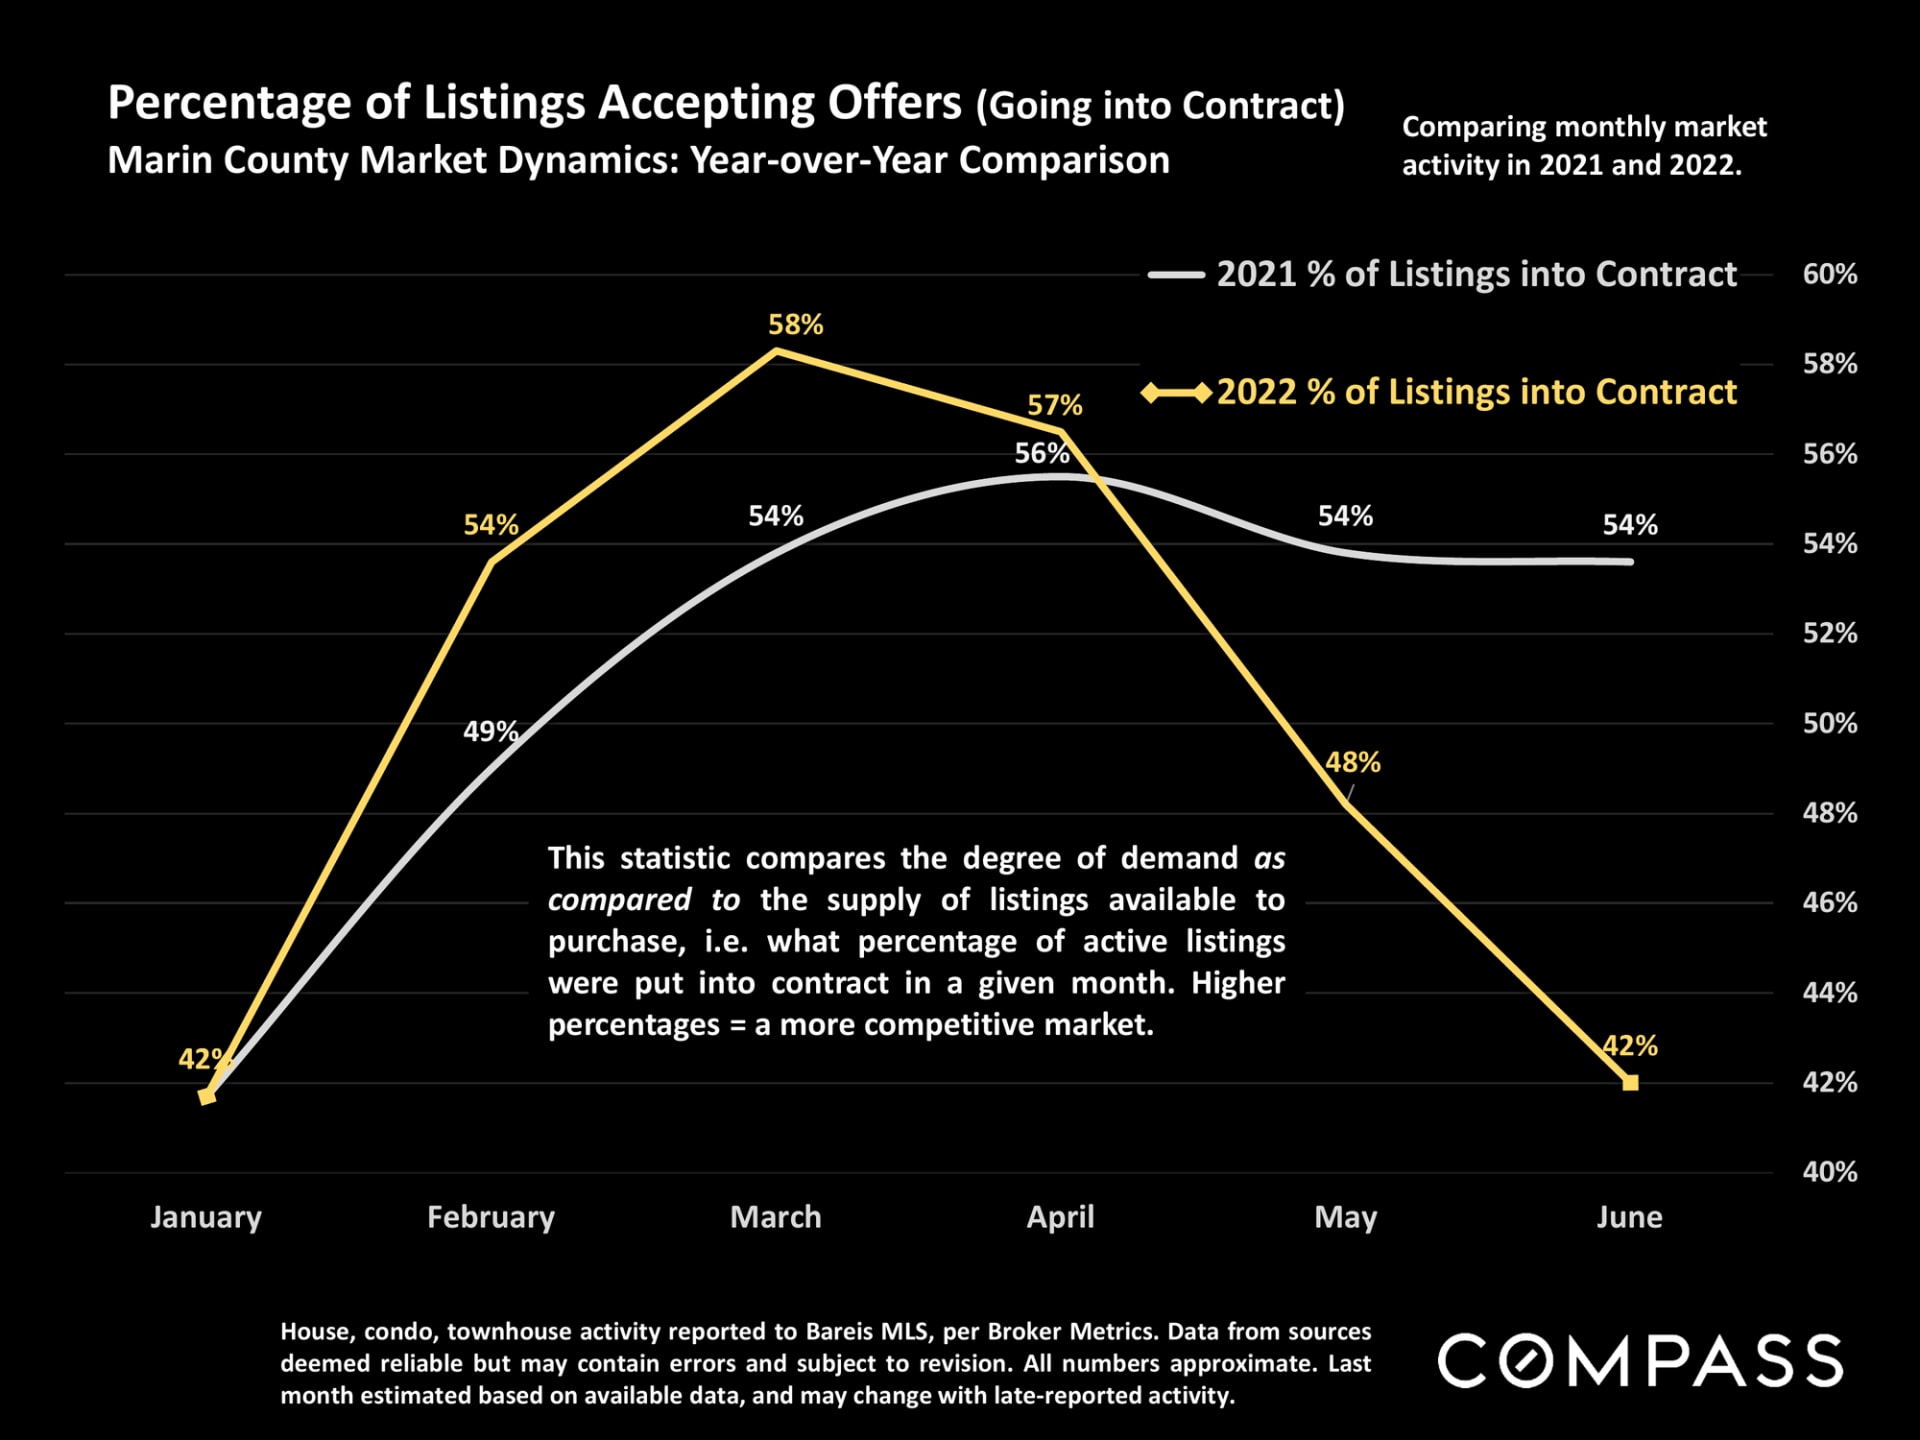
Chart comparing Marin County listings going into contract in 2021 and 2022, with 2022 peaking at 58% in March.


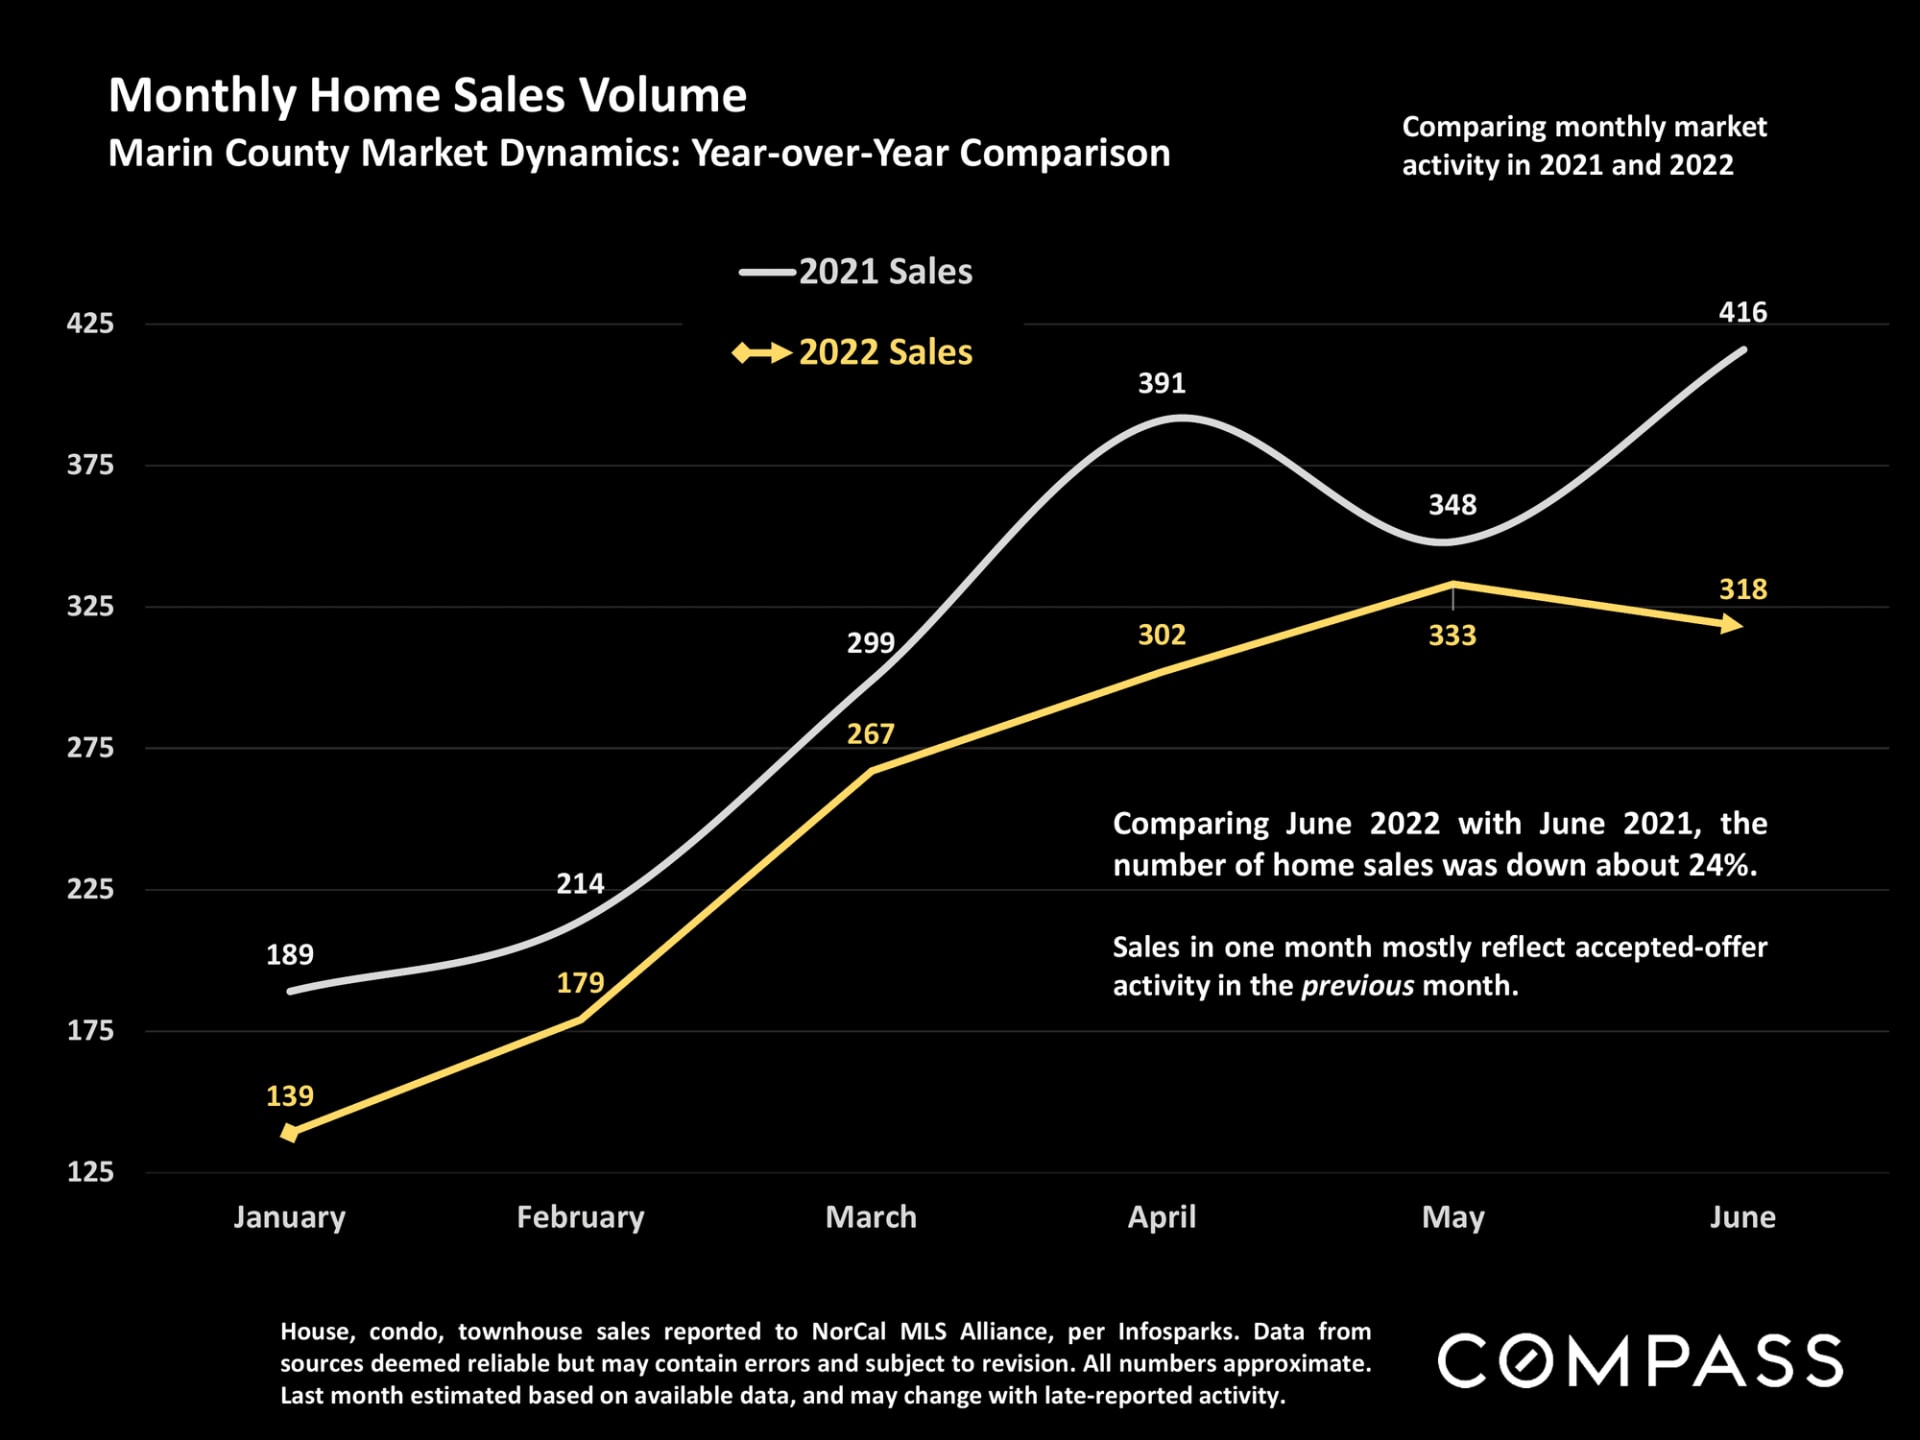
Chart comparing monthly Marin County home sales in 2021 and 2022, with June sales down about 24%.


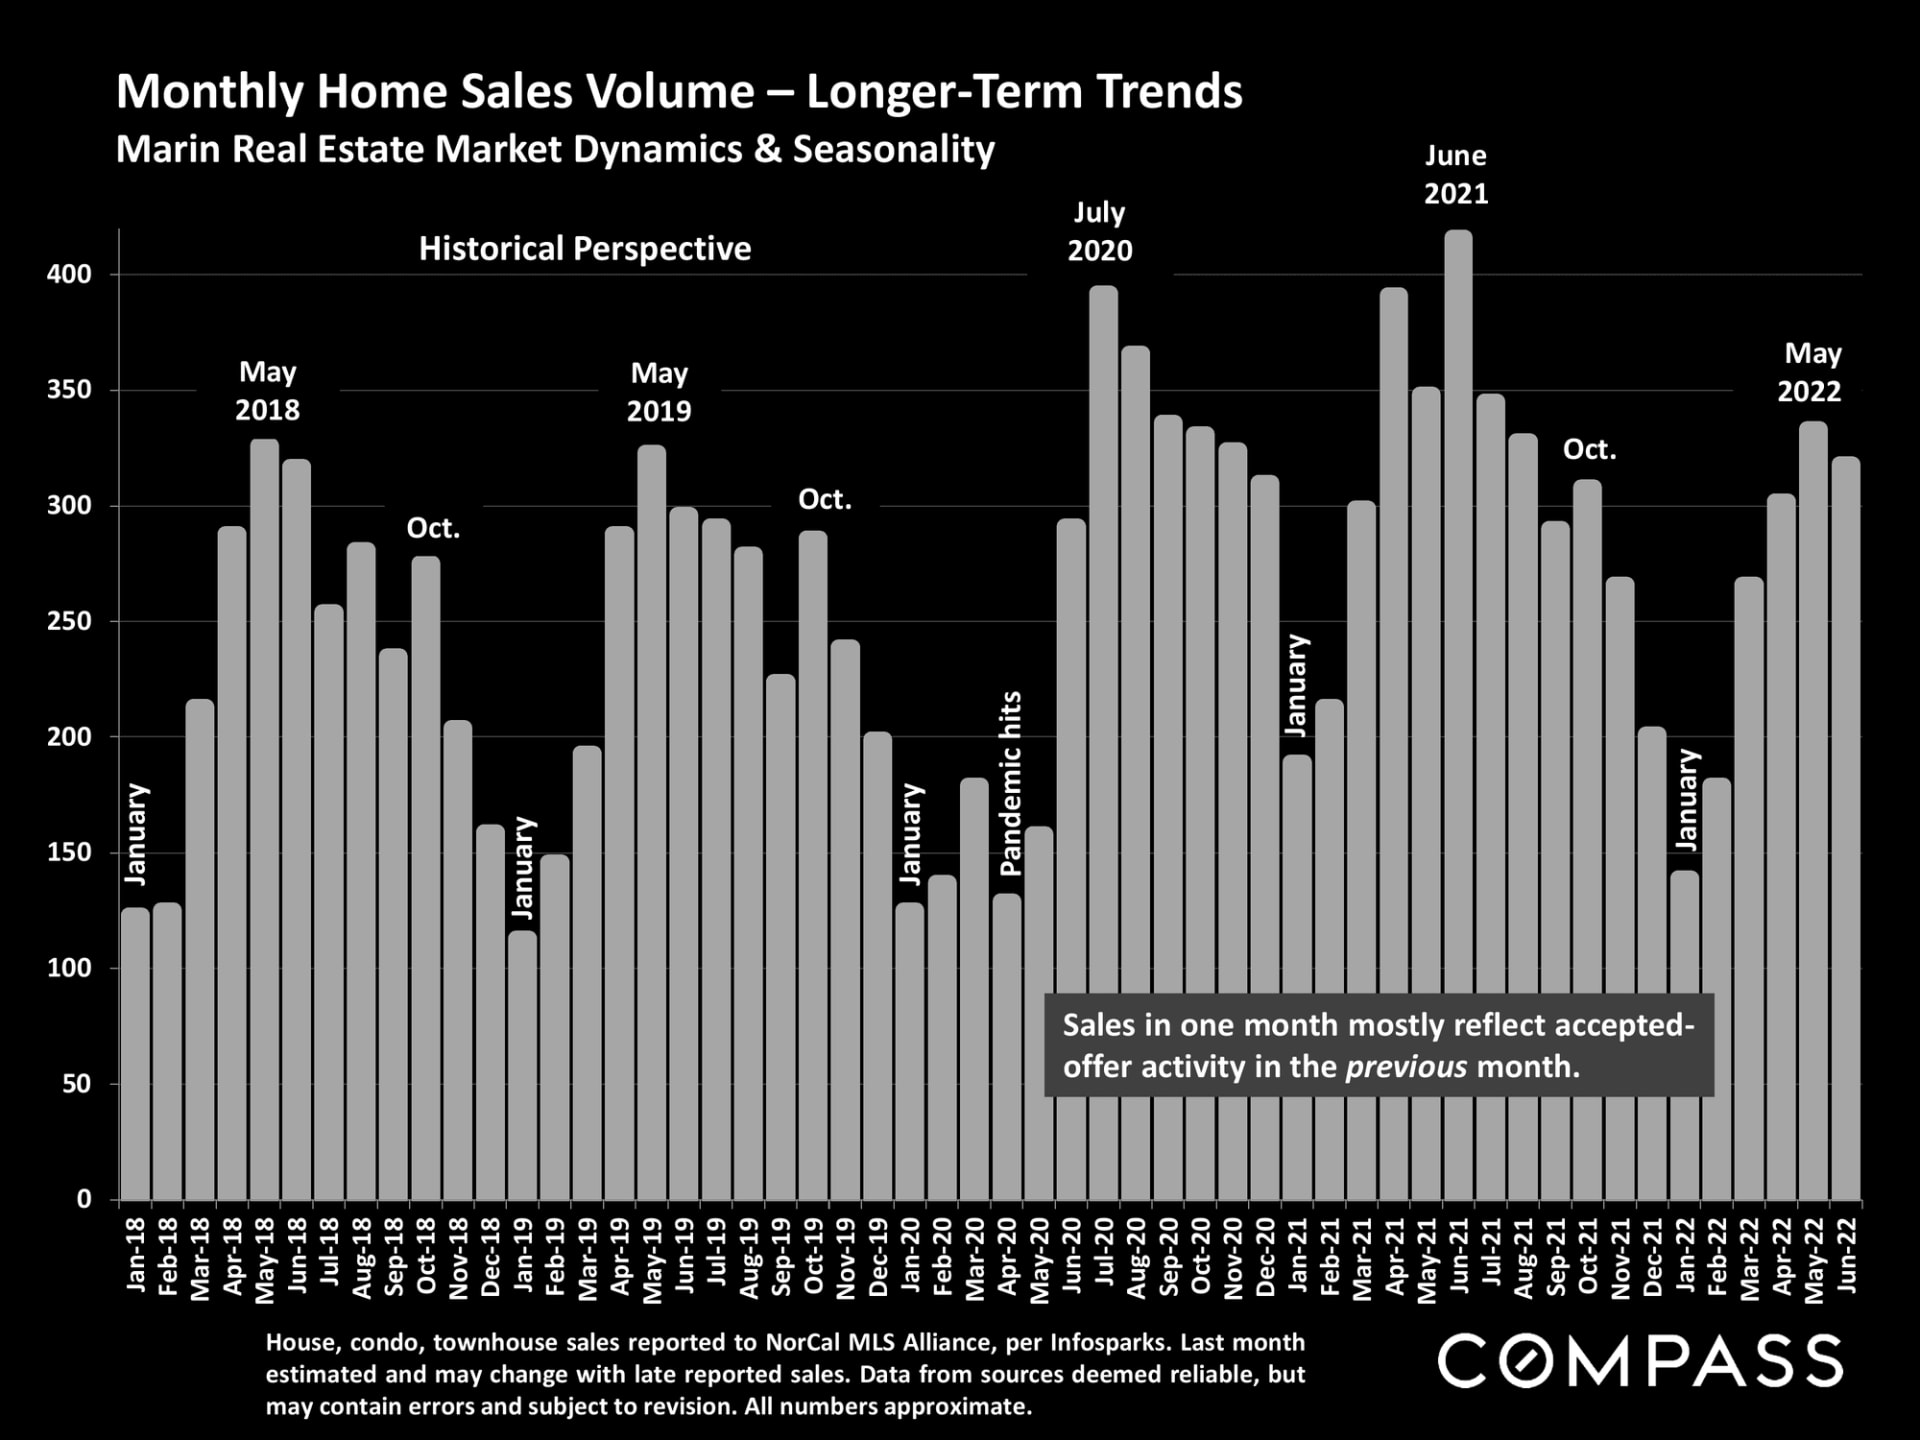
Bar chart of monthly Marin home sales, January 2018–June 2022, with seasonal peaks and the 2020–2021 sales surge.


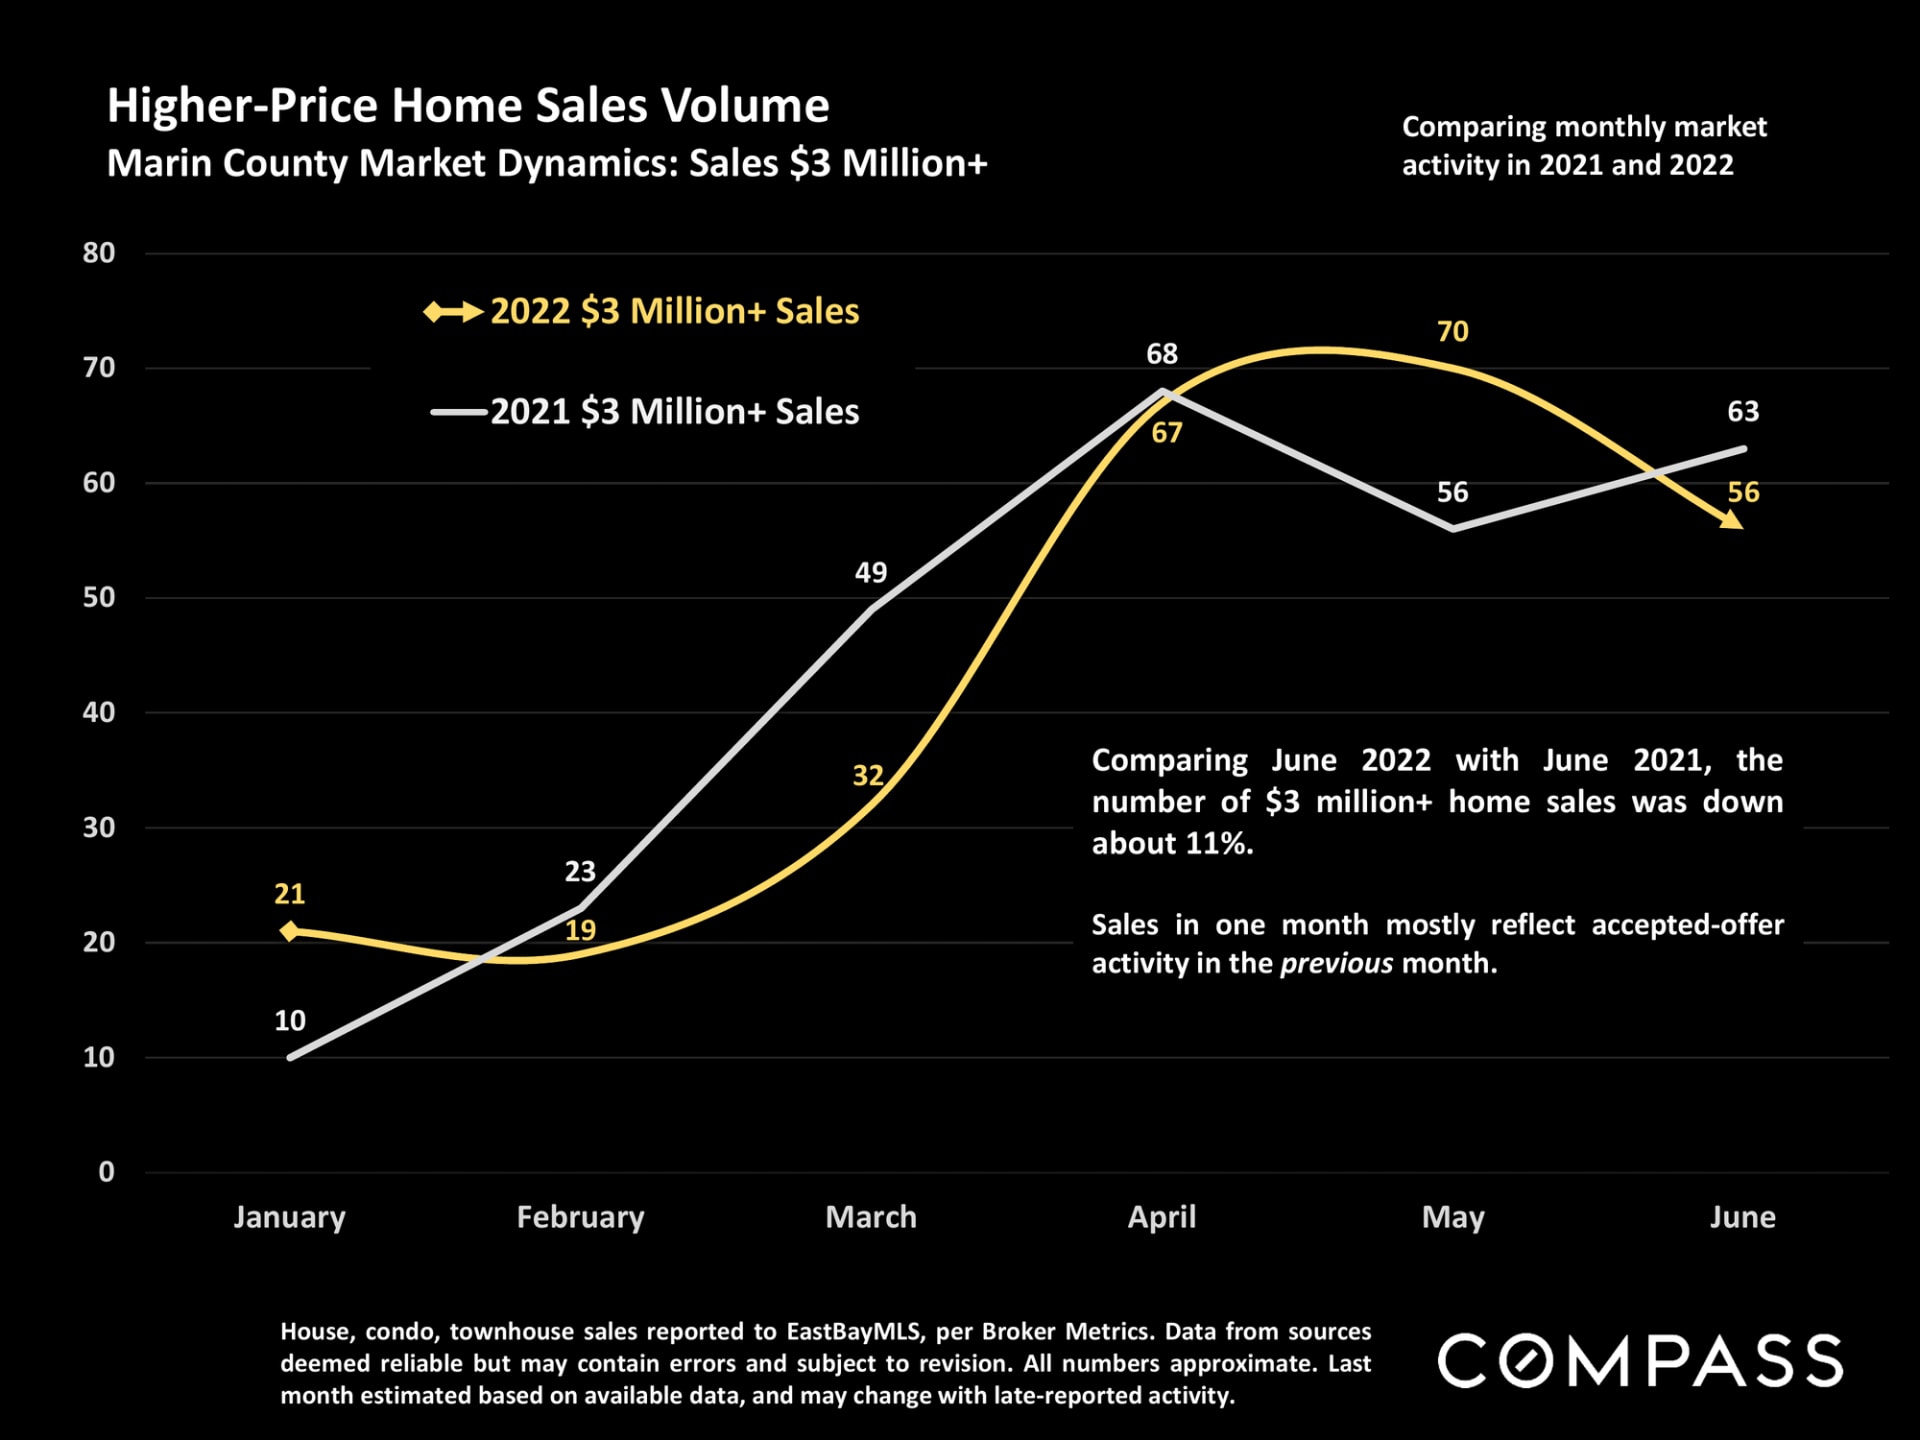
Chart comparing monthly Marin County sales of $3 million-plus homes in 2021 and 2022; June 2022 sales fell about 11%.


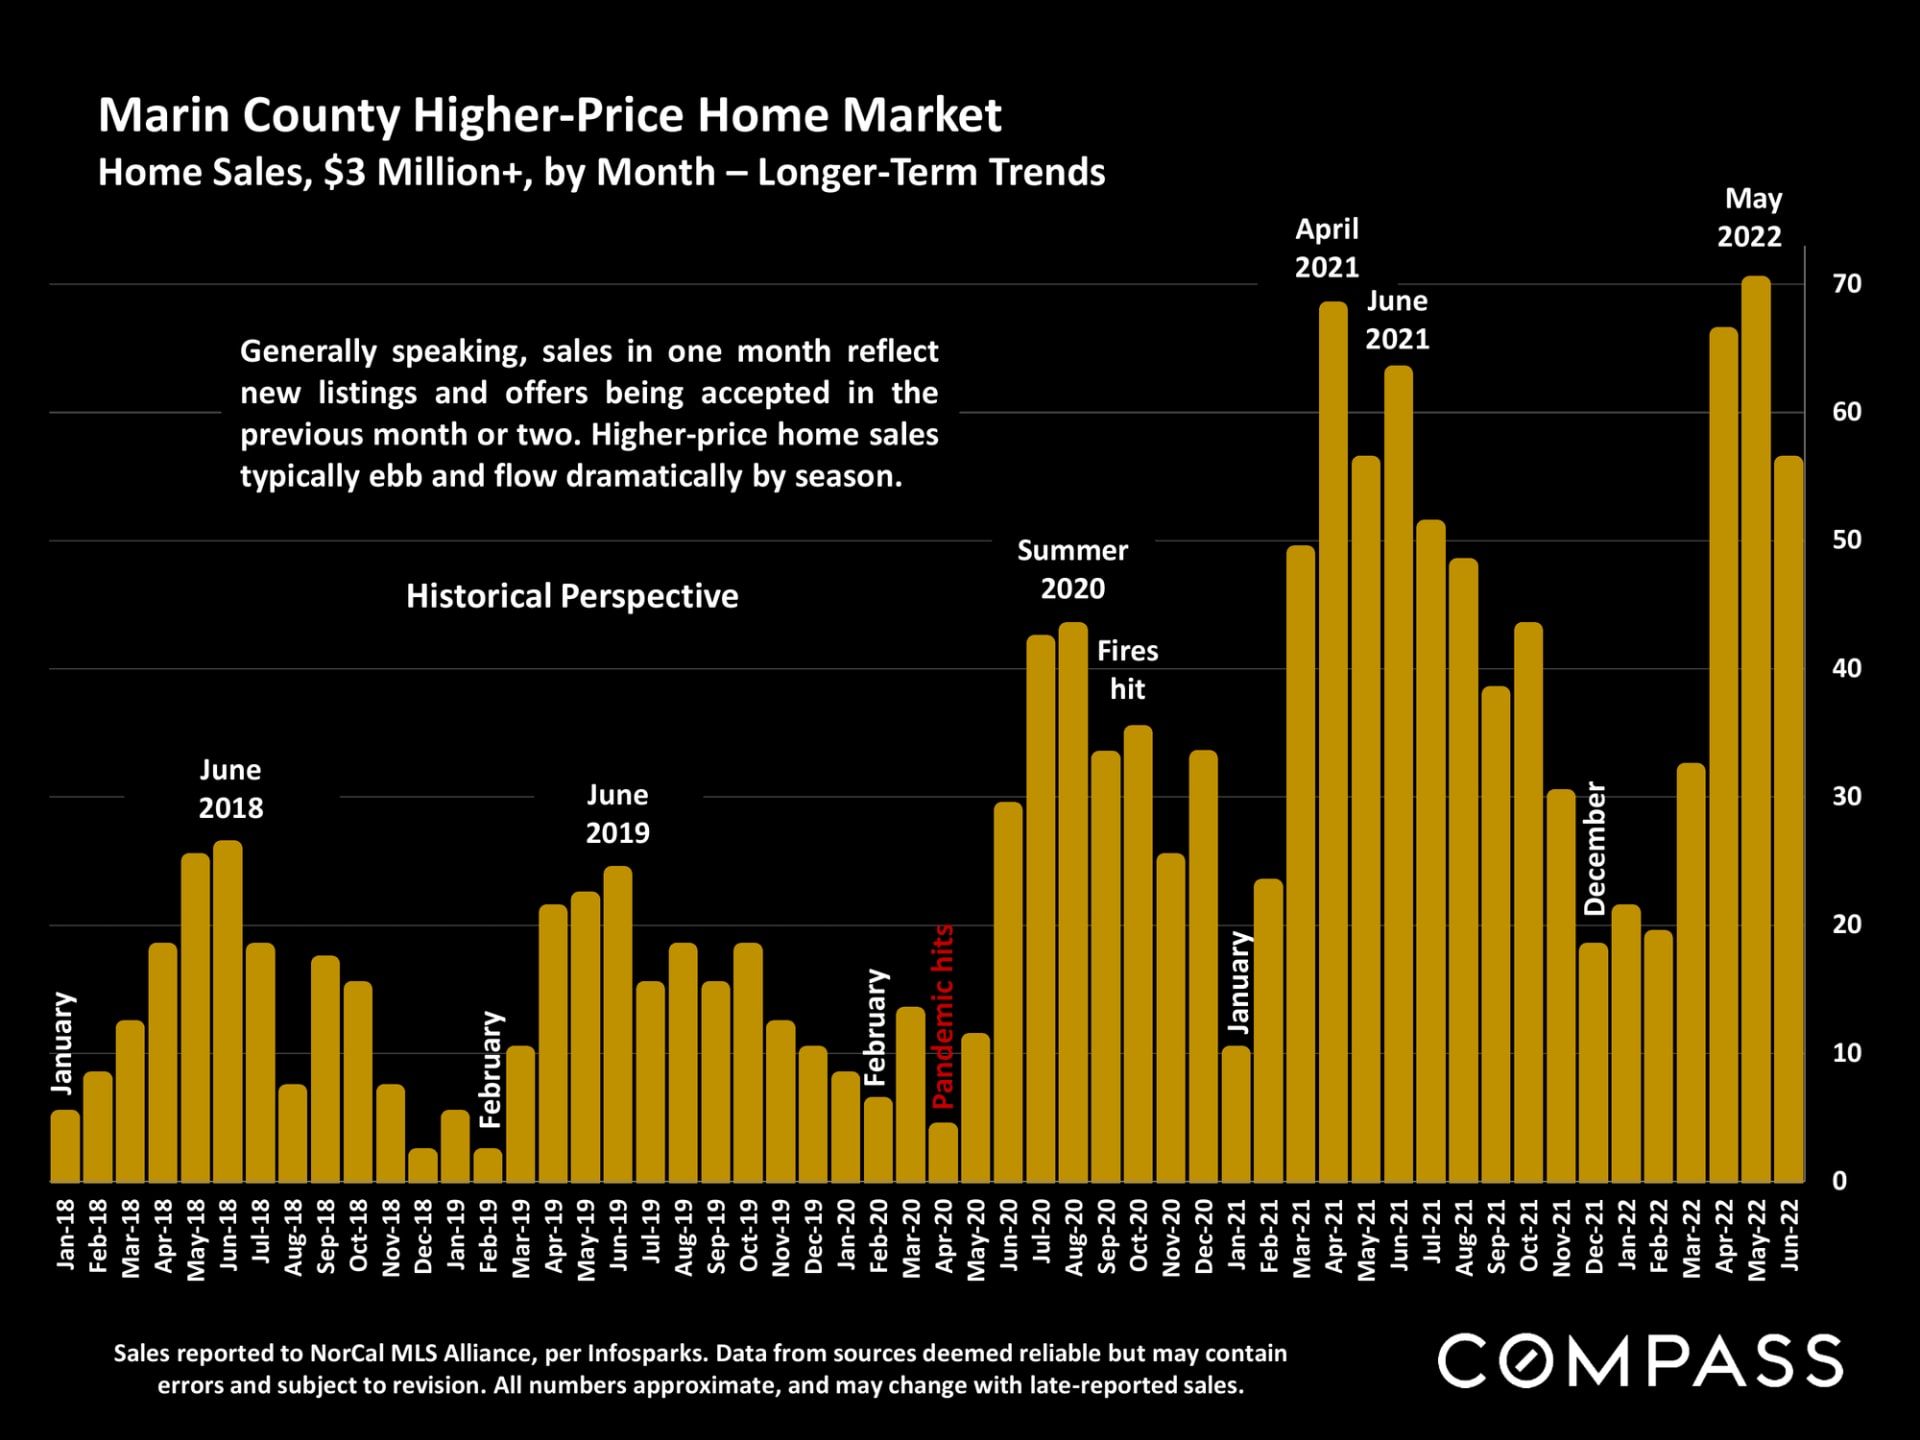
Bar chart of Marin County monthly home sales over $3 million, January 2018 to June 2022, with seasonal and event annotations.


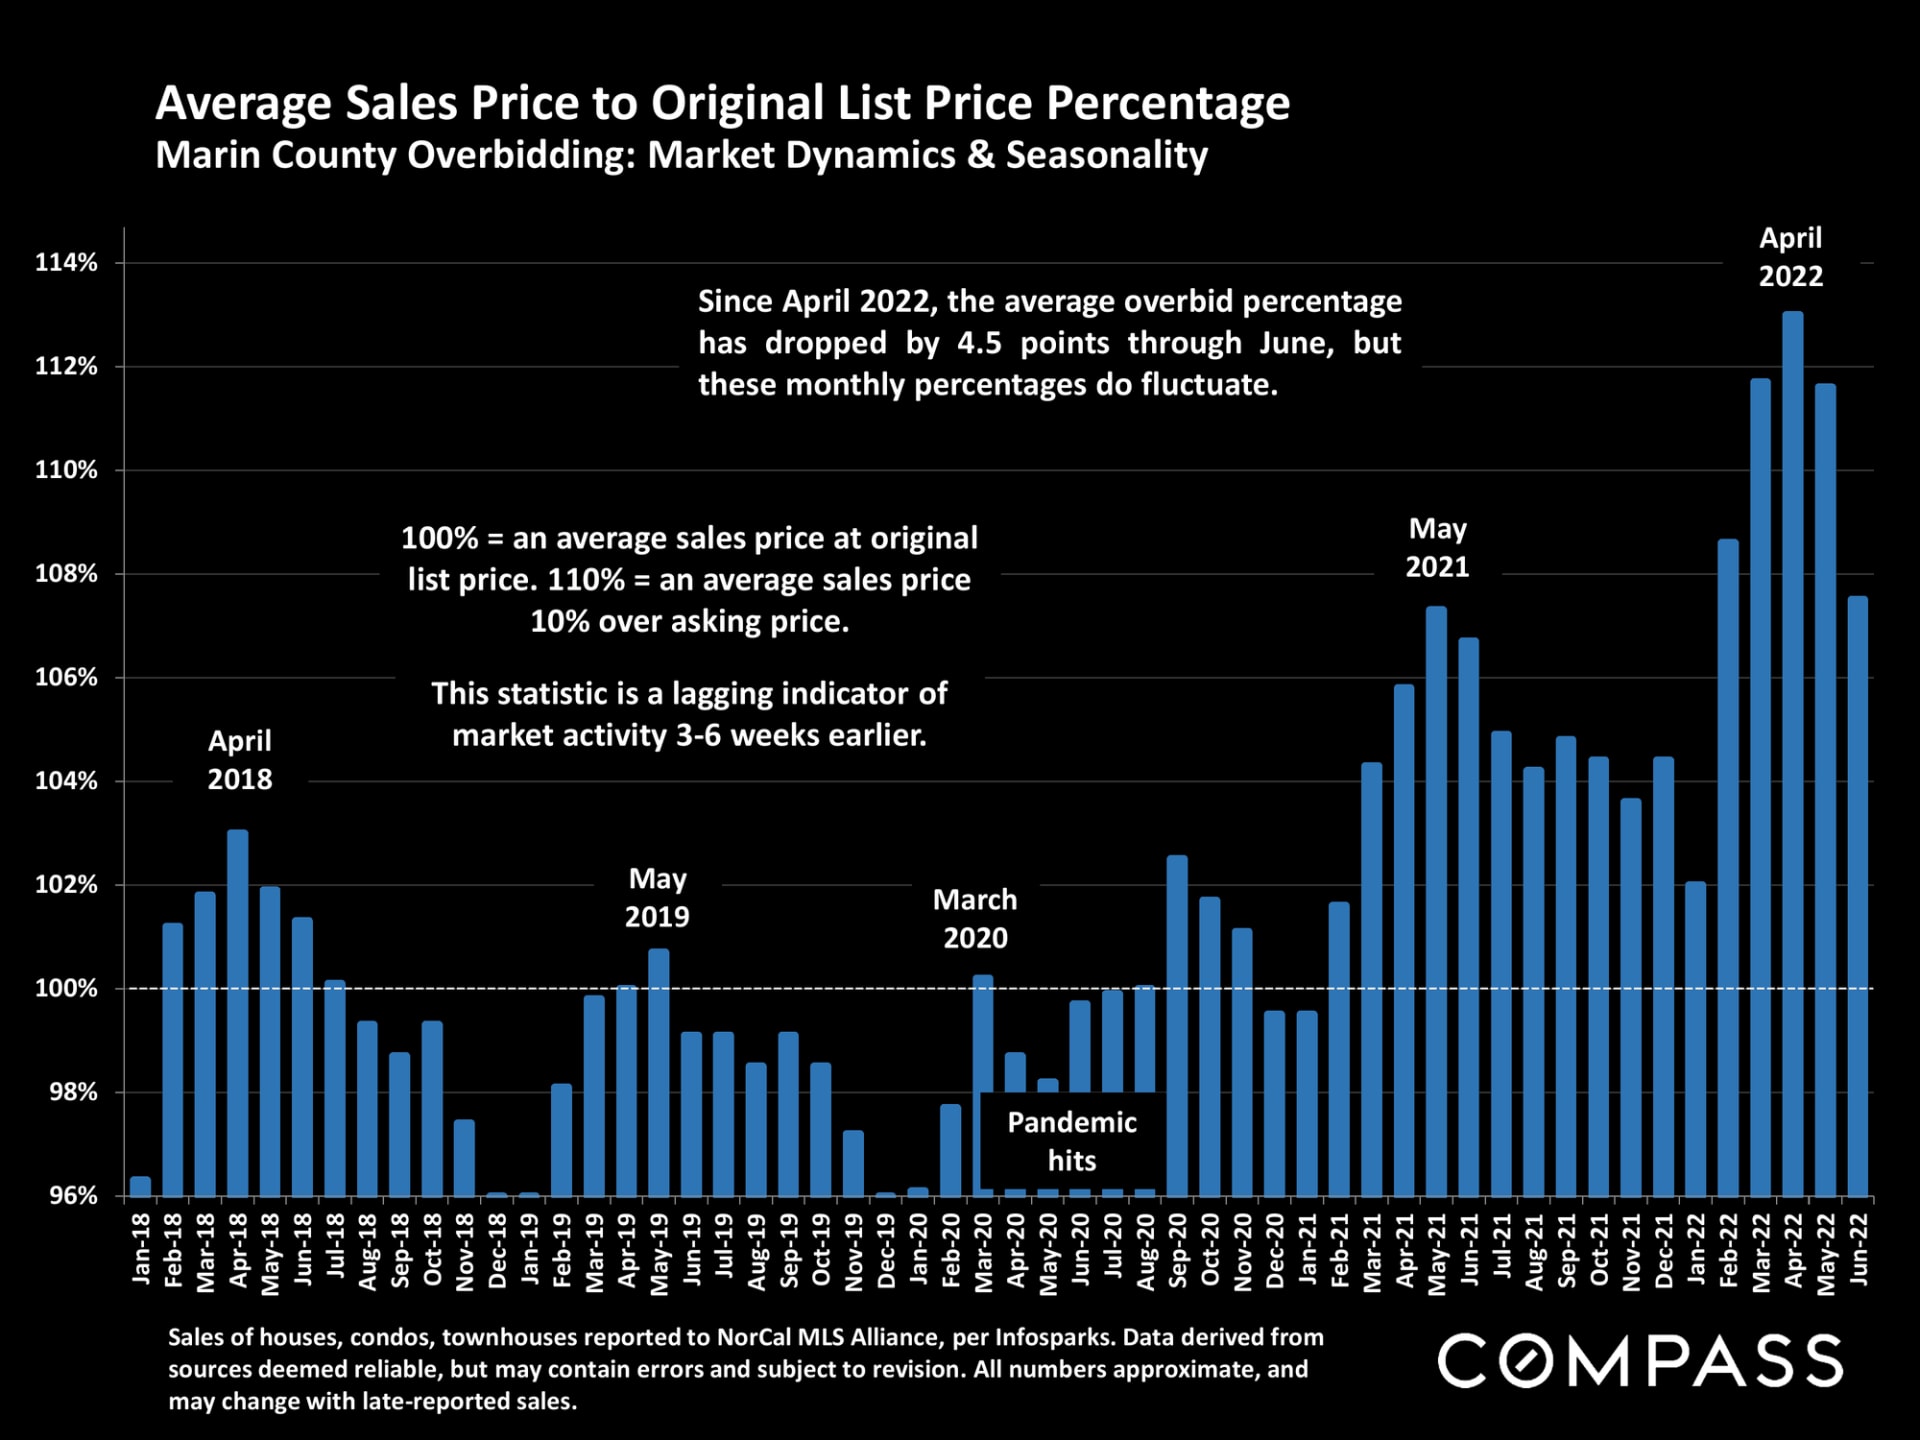
Chart of Marin County sale prices versus original list prices, January 2018–June 2022, peaking in April 2022.


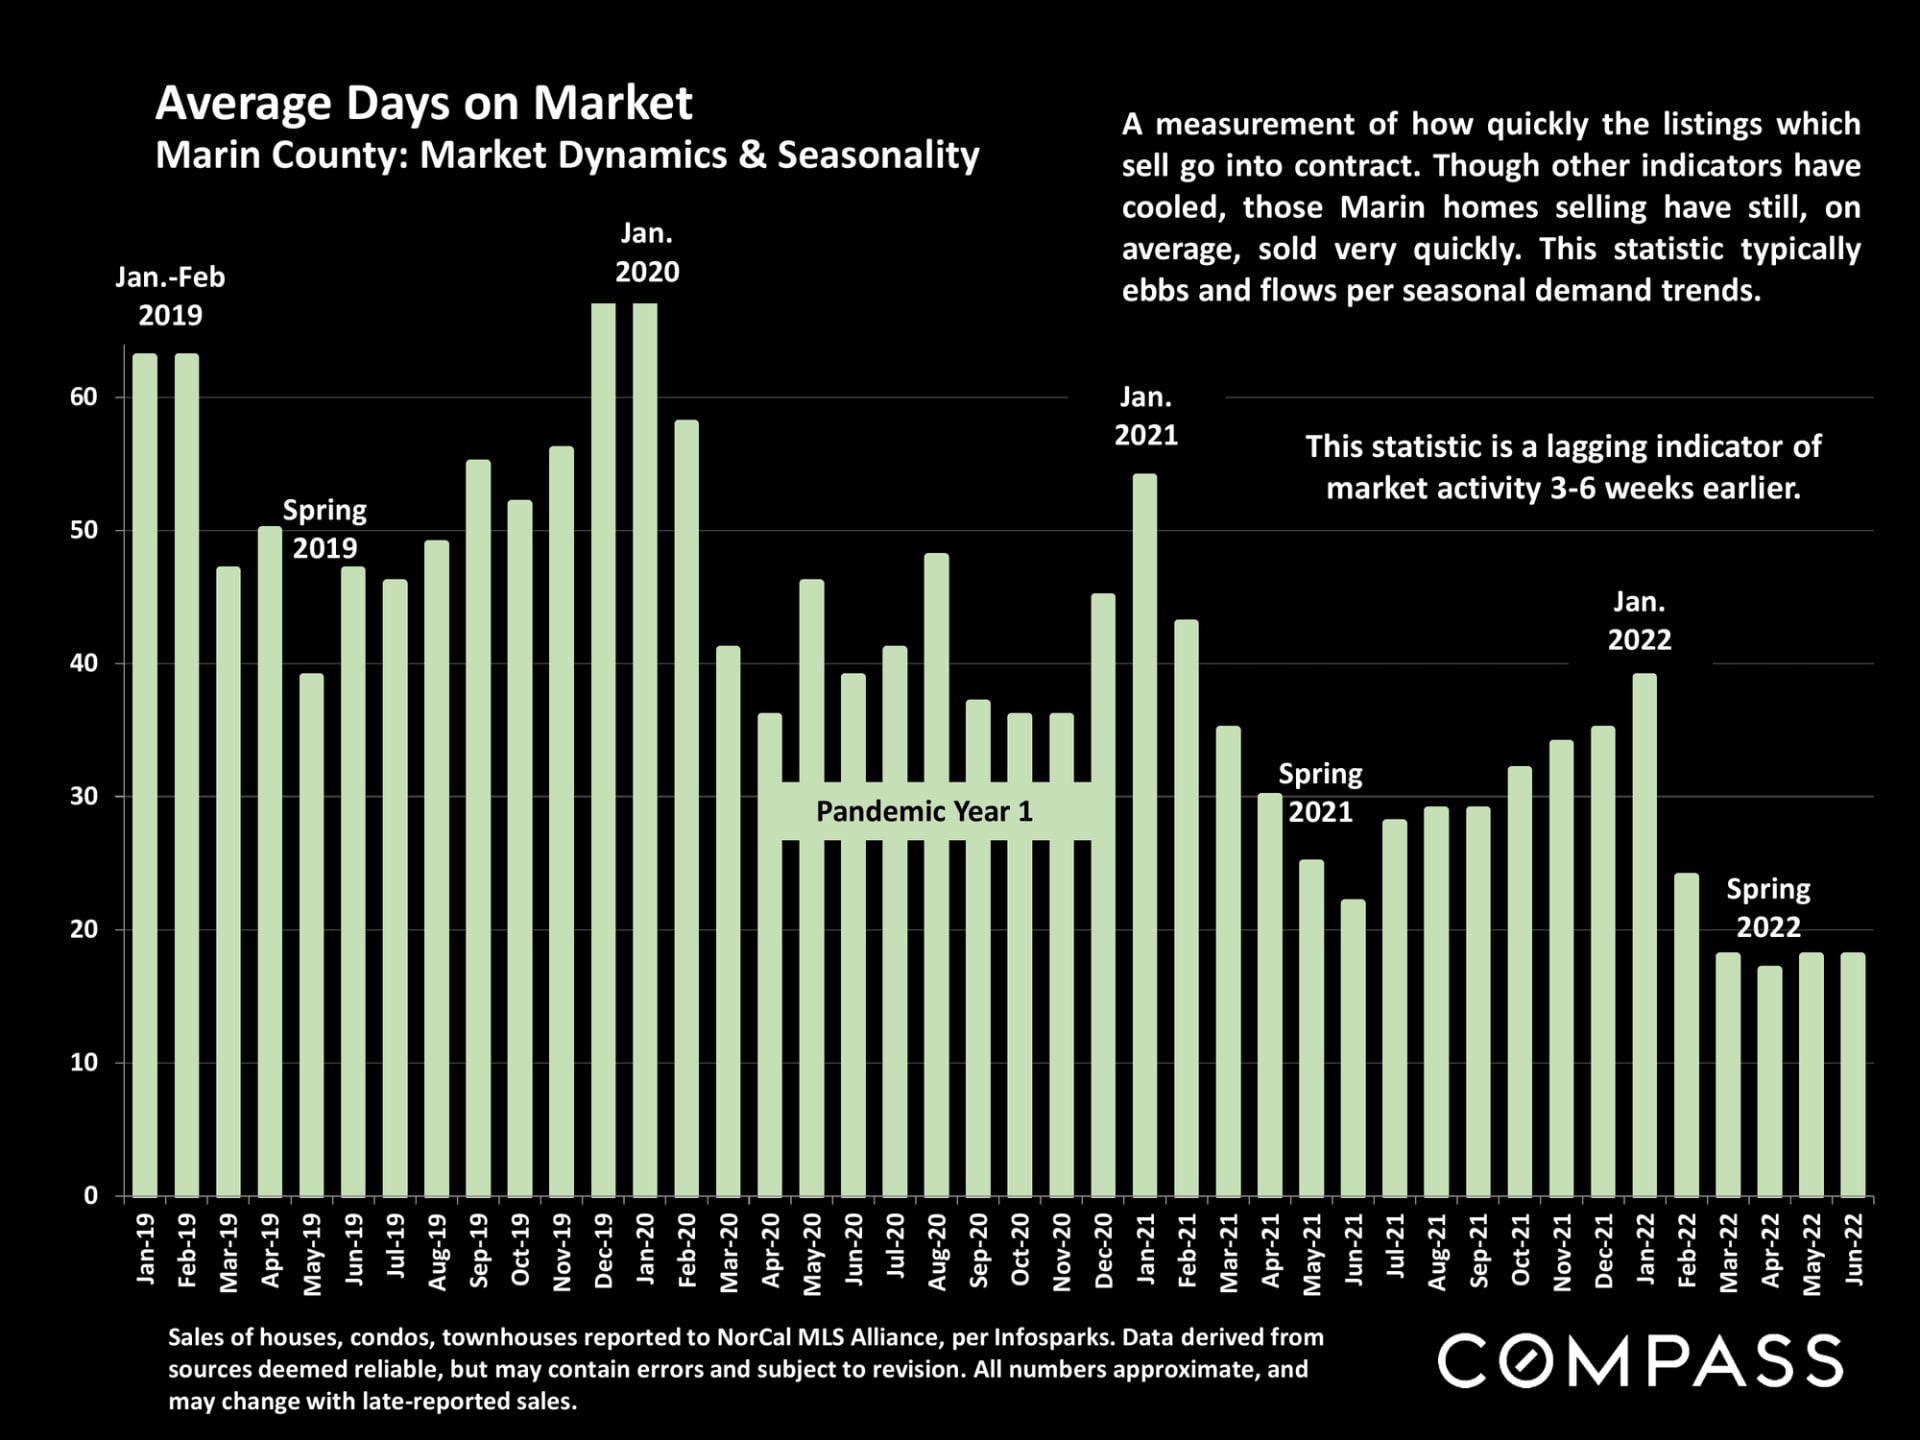
Bar chart shows Marin County homes’ average days on market declining from 2019 through June 2022.


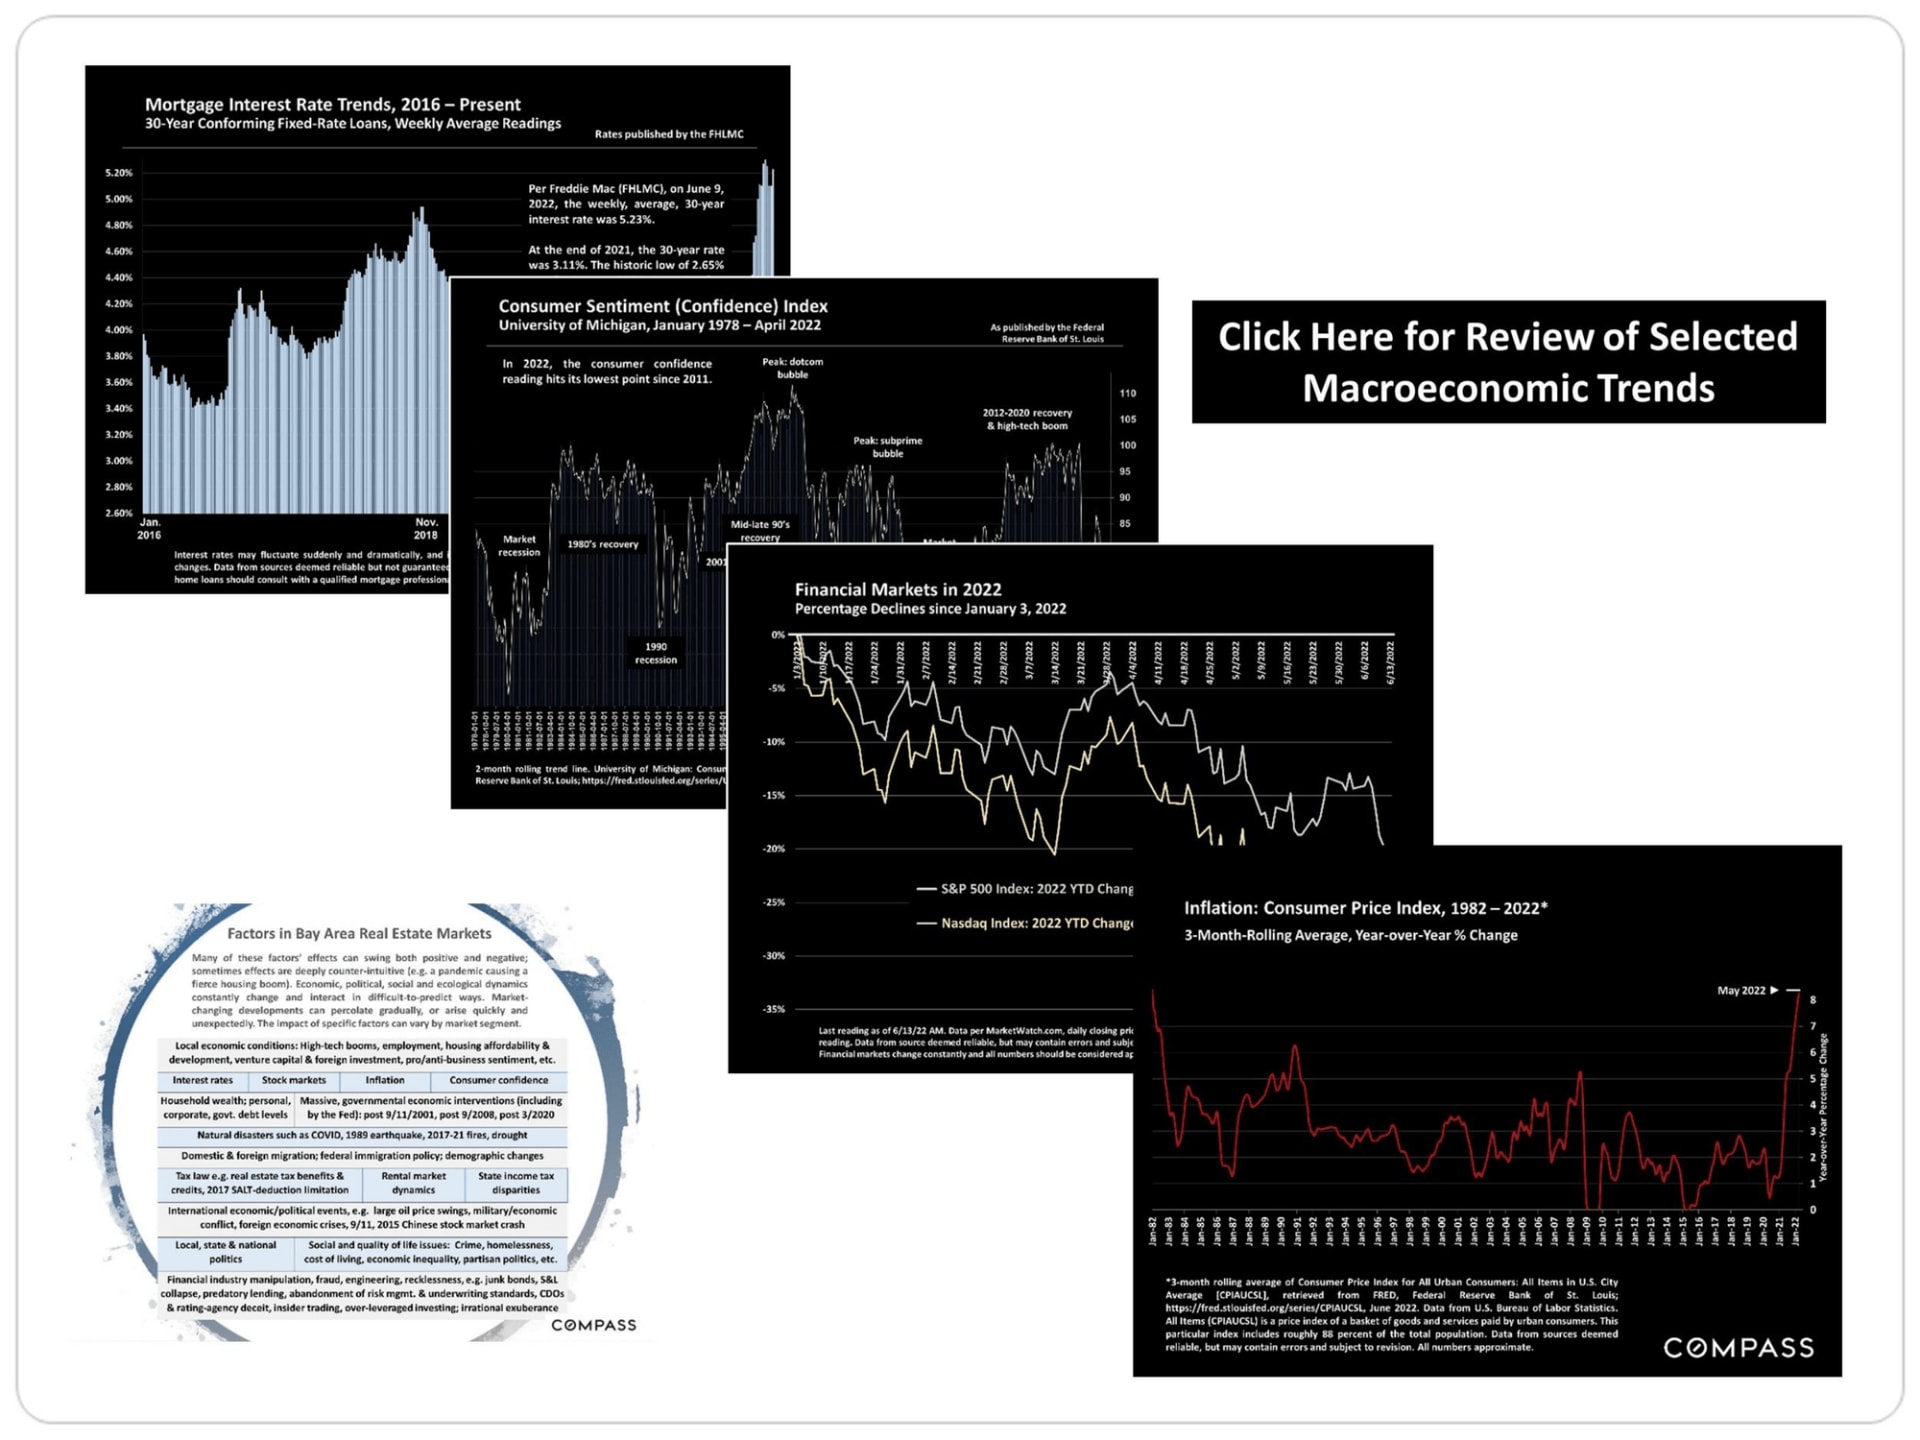
Macroeconomic charts covering mortgage rates, consumer sentiment, 2022 market declines, inflation, and Bay Area real estate factors.


Macroeconomic Trends


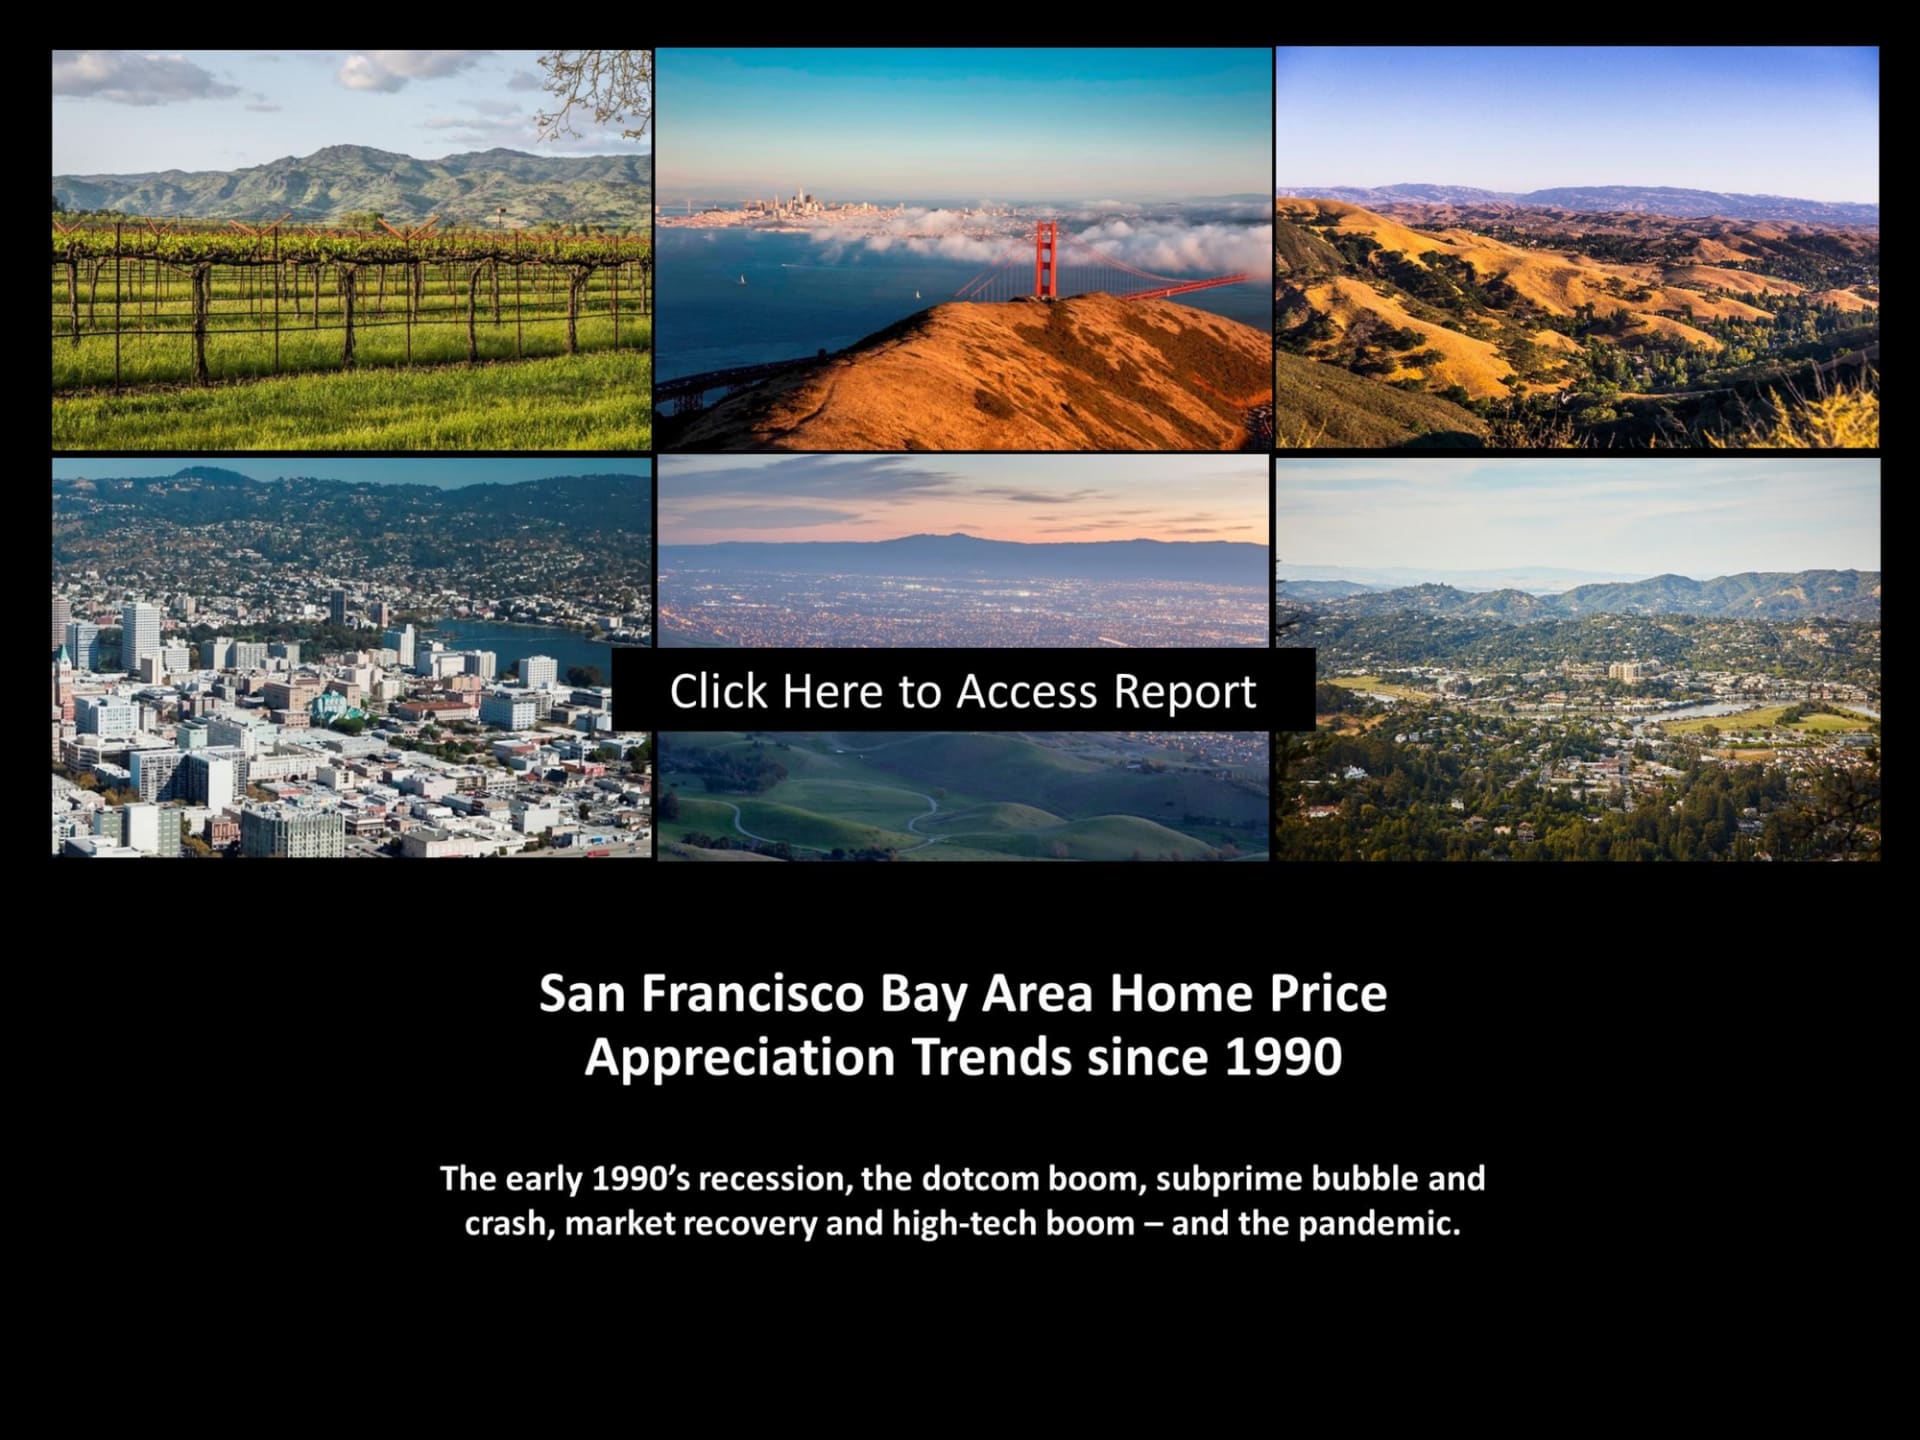
San Francisco Bay Area Real Estate Survey report access graphic


San Francisco Bay Area Real Estate


San Francisco Bay Area home price appreciation report, with regional landscape collage and link to access it.


San Francisco Bay Area Home Price


Explanatory notes on real estate market statistics and Compass disclaimer.

View More Homes for Sale in Sonoma, Healdsburg, Sebastopol and More

Home Search

Work With Me

My commitment to ethical representation and depth of experience are the foundation of my success.
Contact Me

Follow Us on Instagram