Blog

Sonoma County Real Estate October 2022 Report

Sonoma County Real Estate October 2022 Report
 
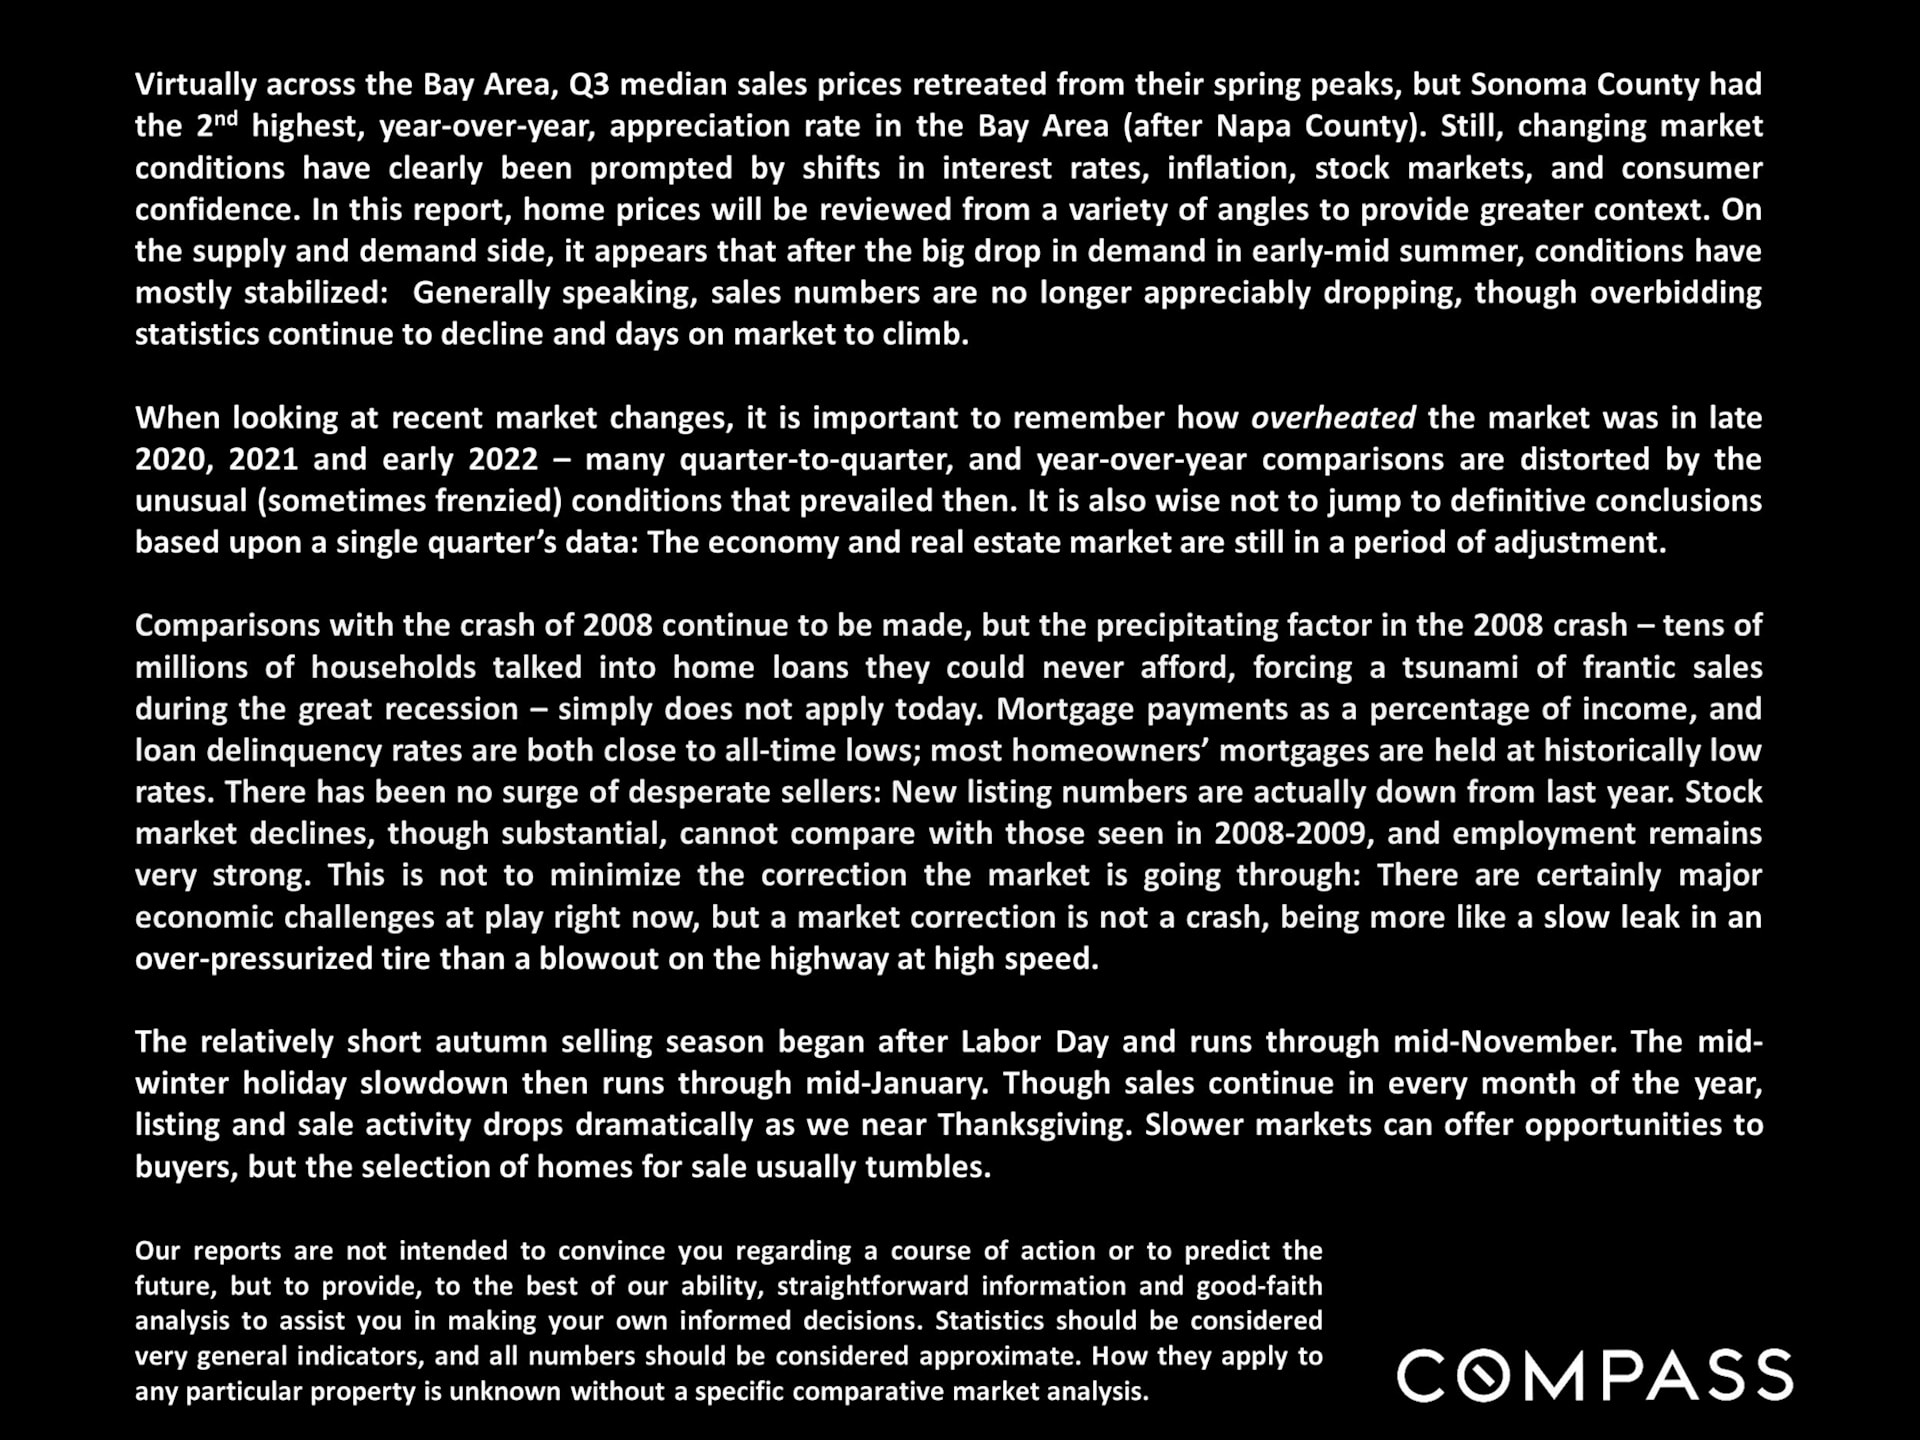
Sonoma County October housing market report discussing prices, market conditions, seasonal sales, and Compass analysis.
 
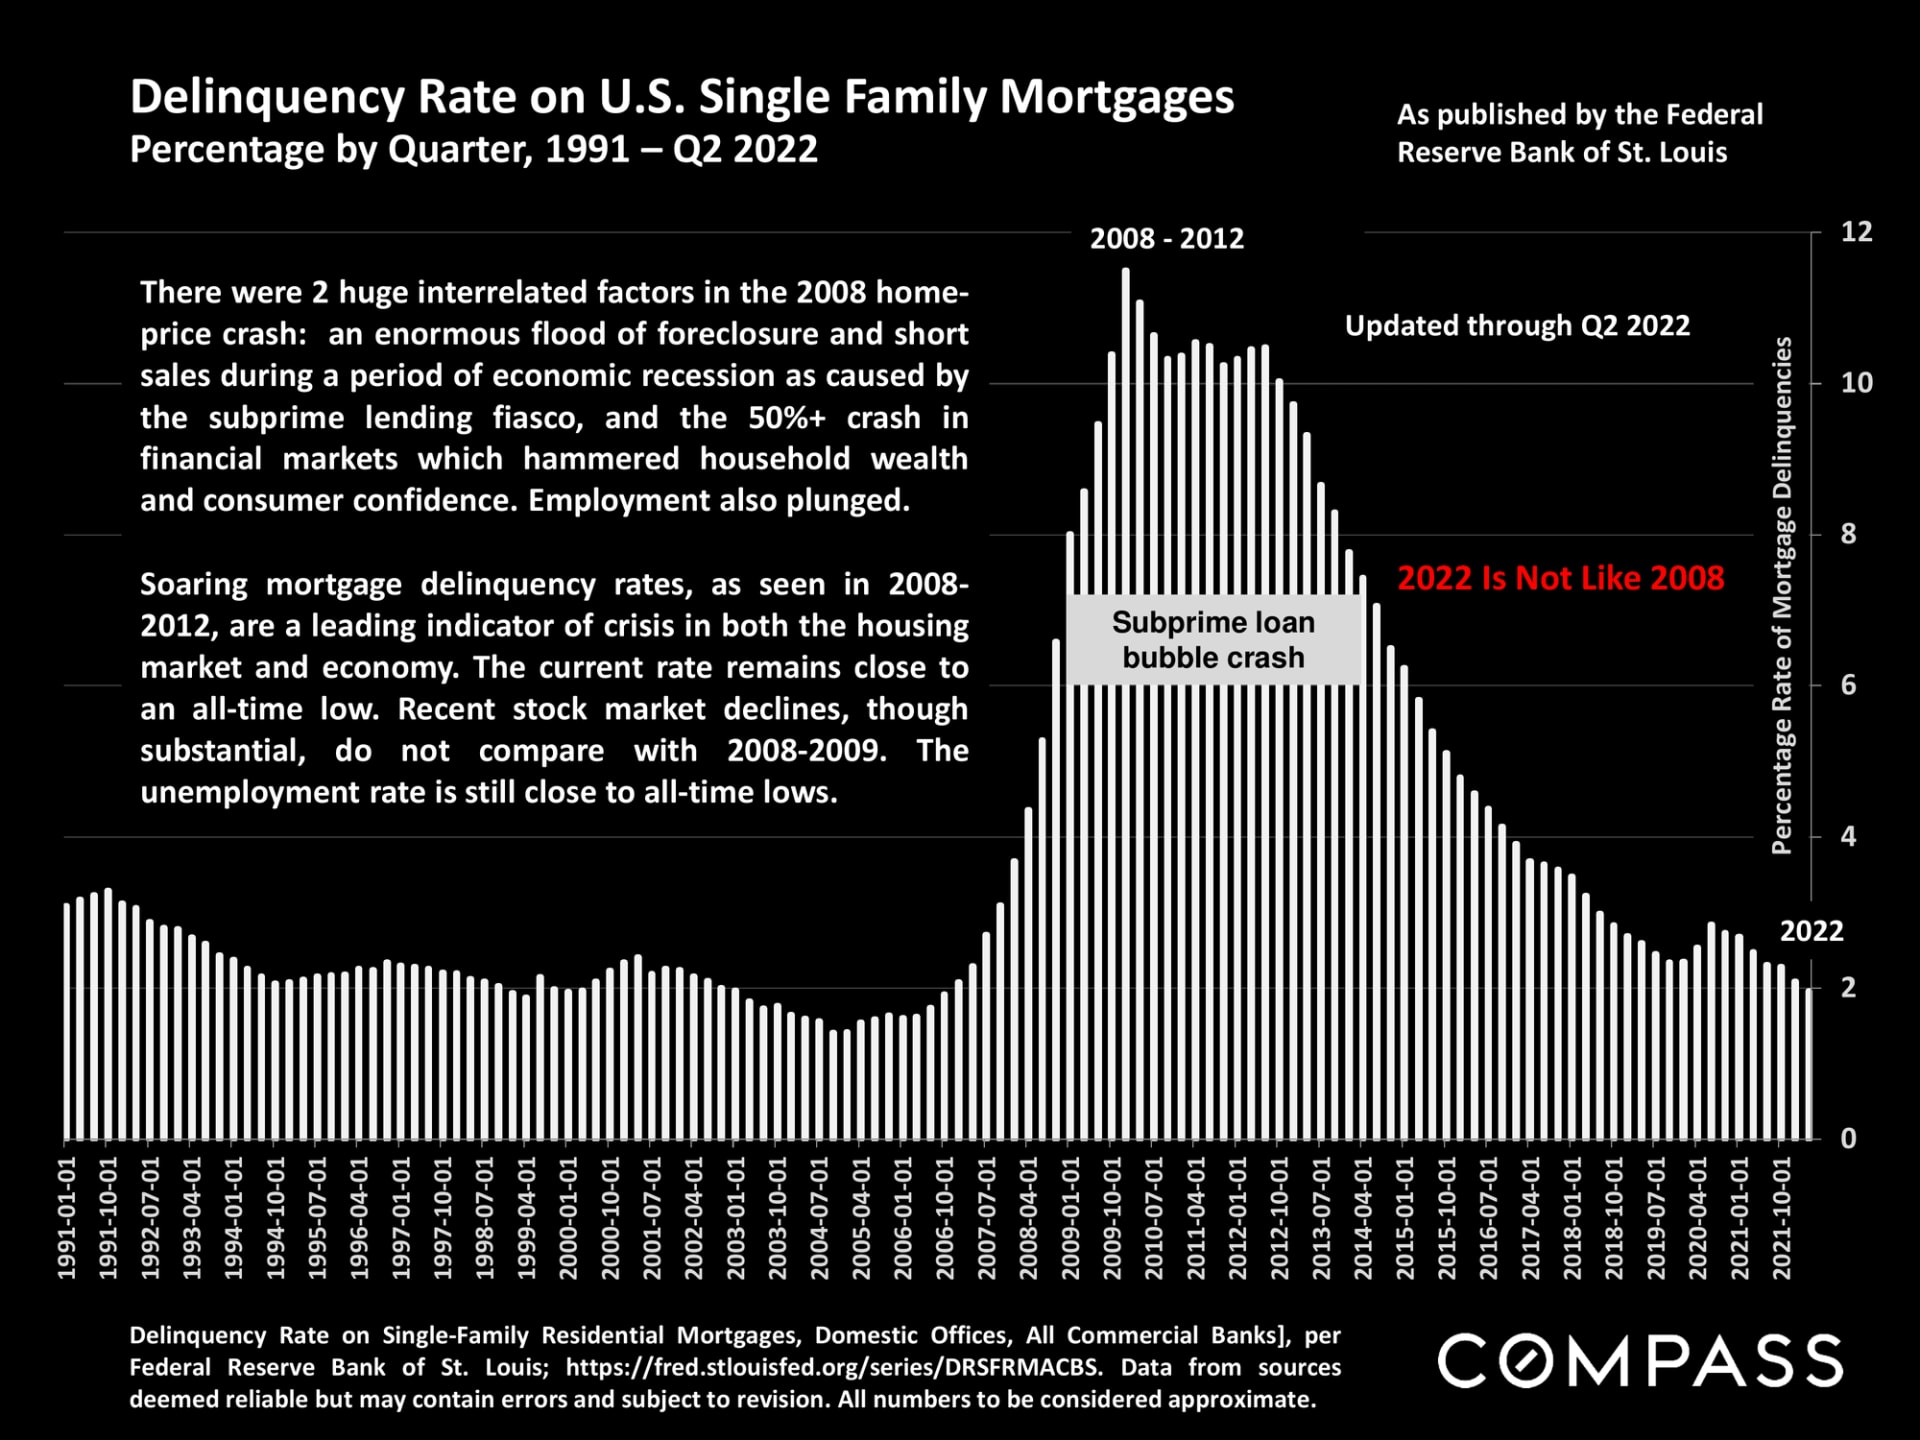
Bar chart of U.S. mortgage delinquency rates, peaking during 2008–2012 and near historic lows in 2022.
 
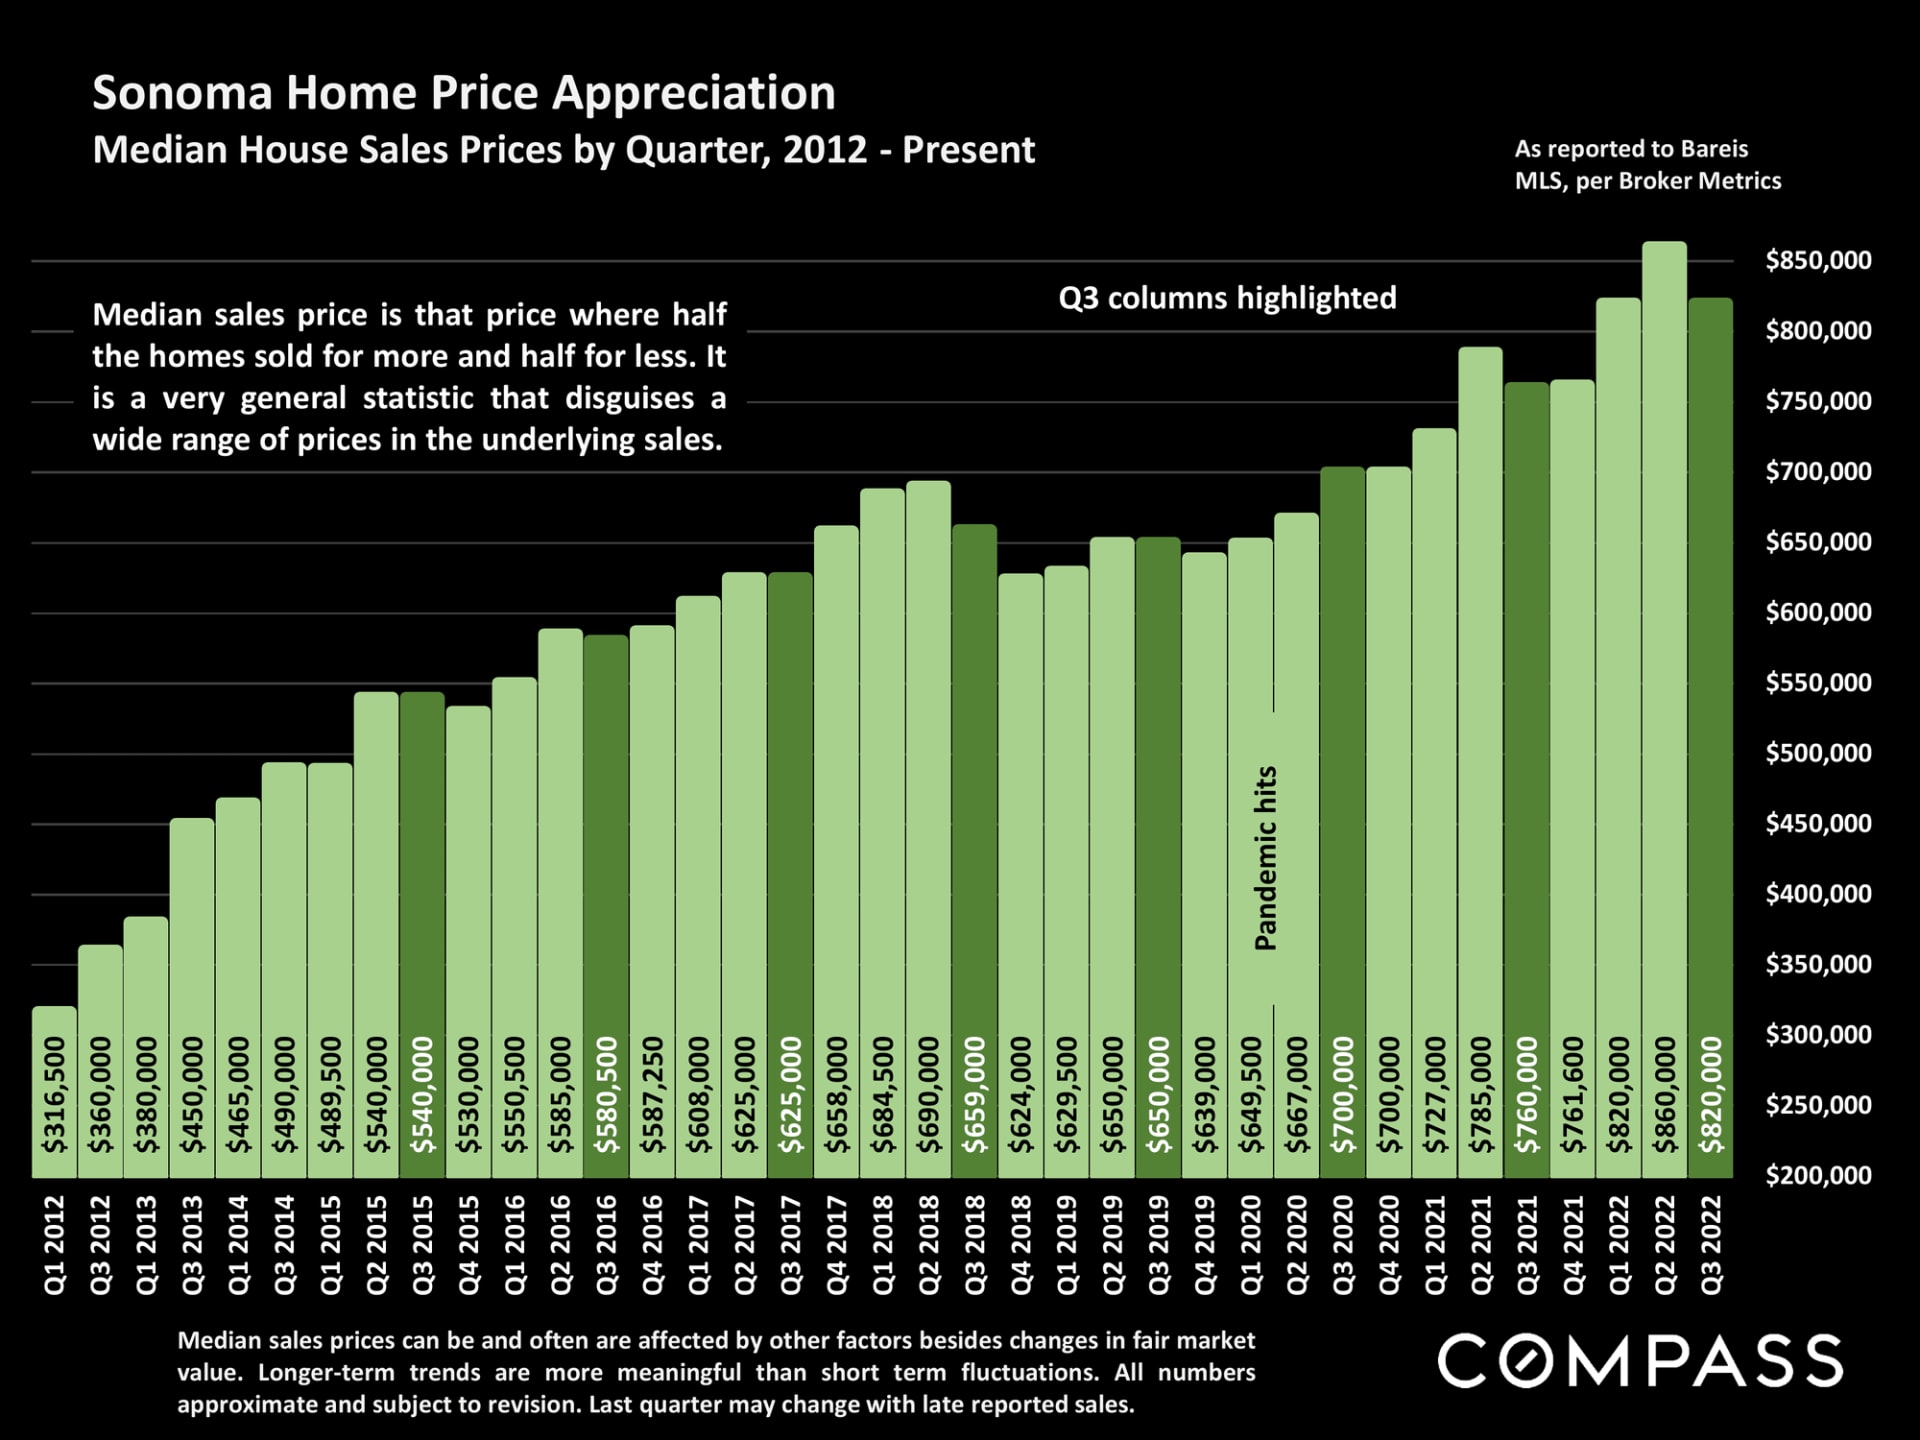
Chart of Sonoma County median home sale prices by quarter, rising from $316,500 in 2012 to $820,000 in 2022.
 
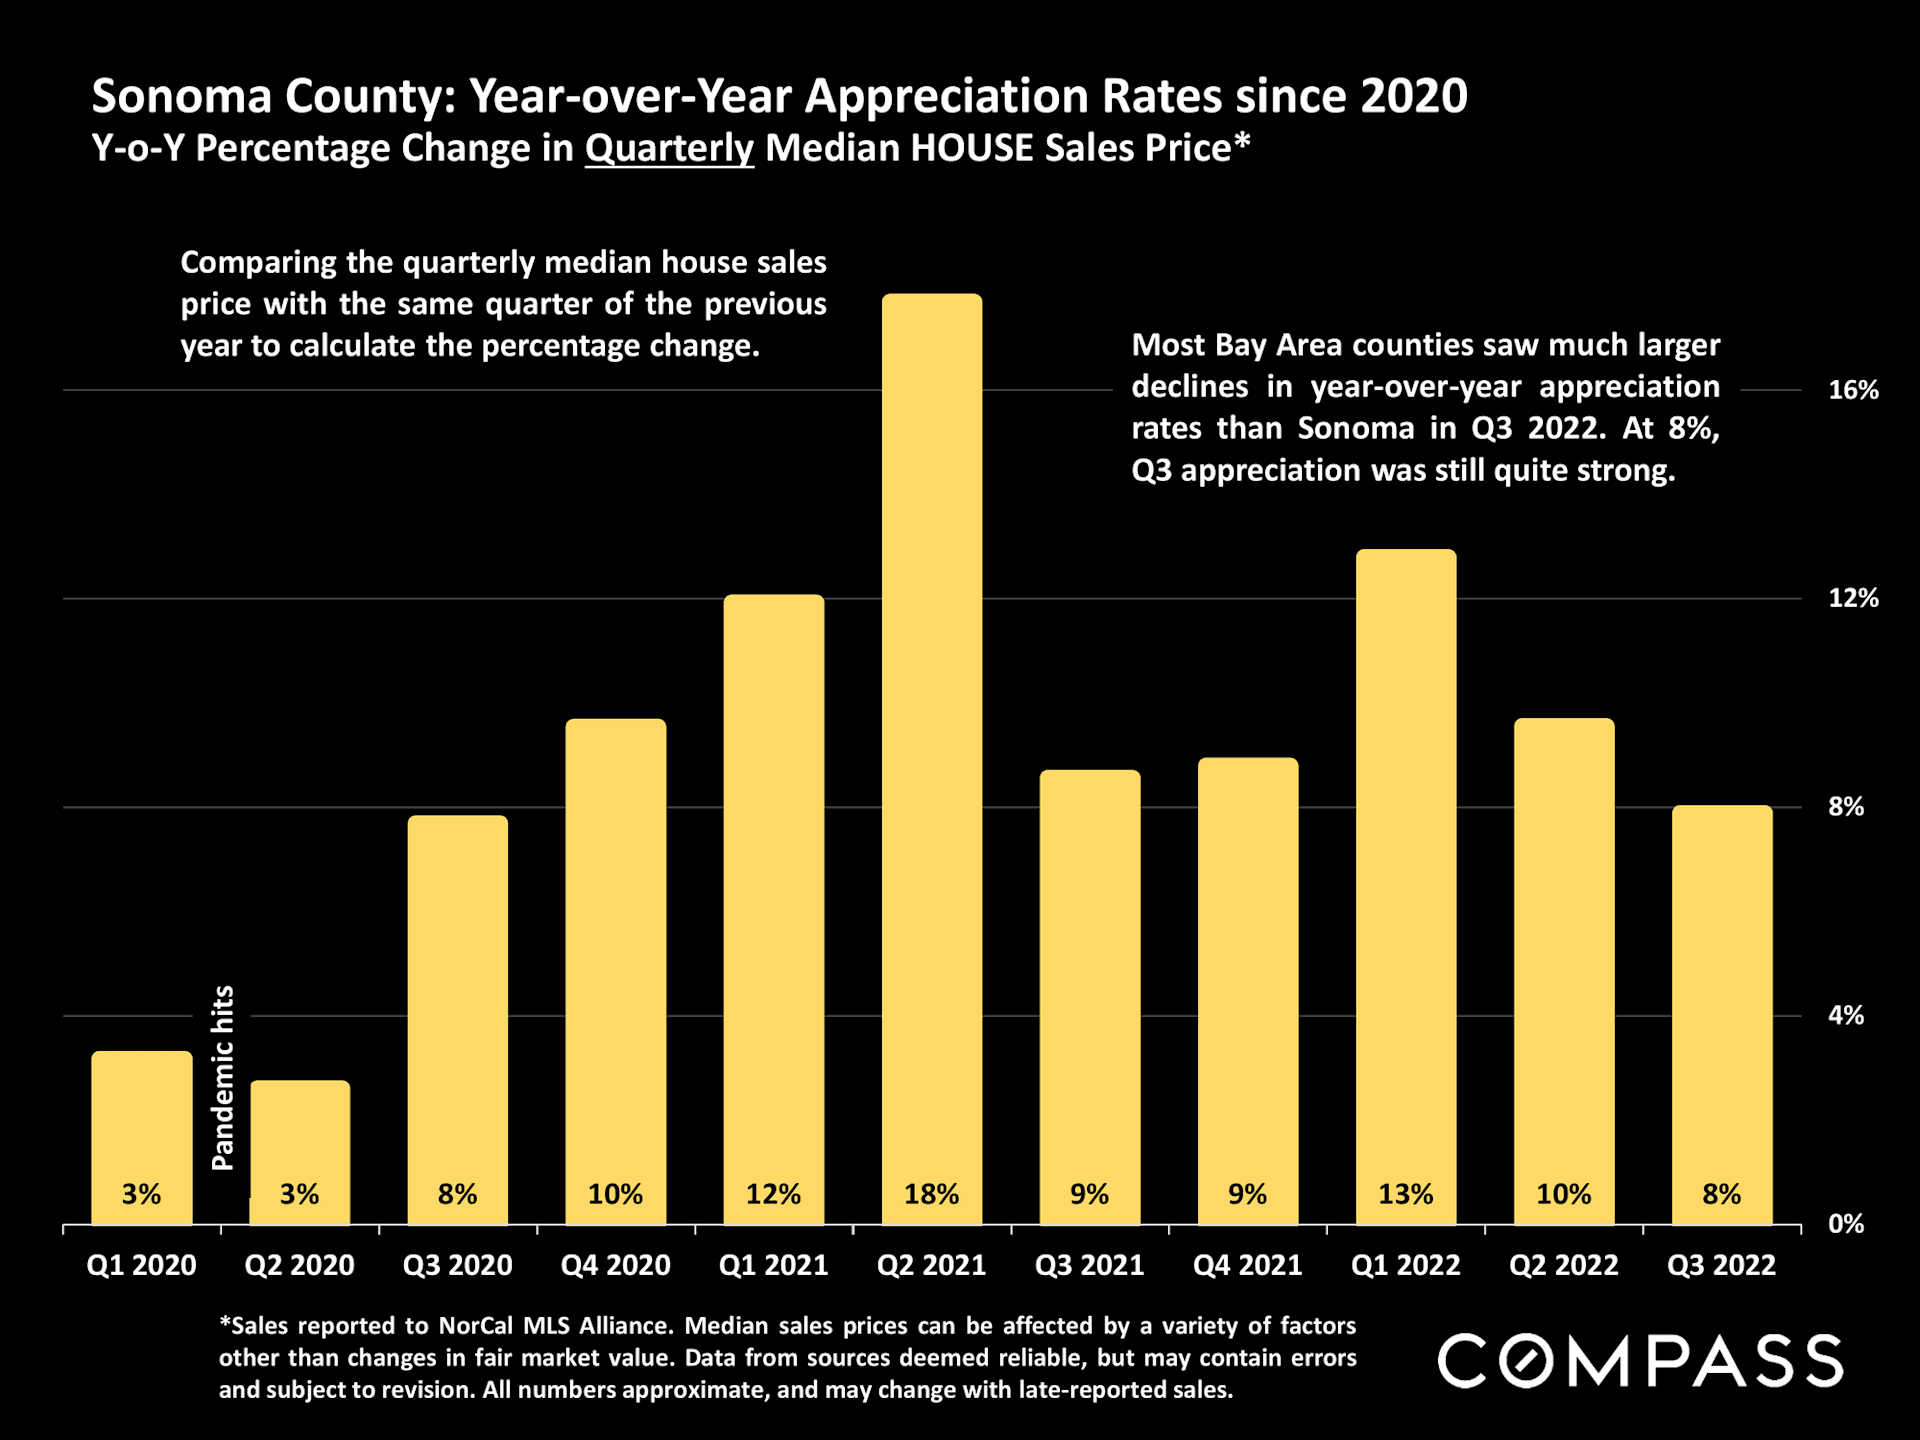
Bar chart of Sonoma County quarterly year-over-year home price appreciation, peaking at 18% in Q2 2021 and reaching 8% in Q3 2022.
 
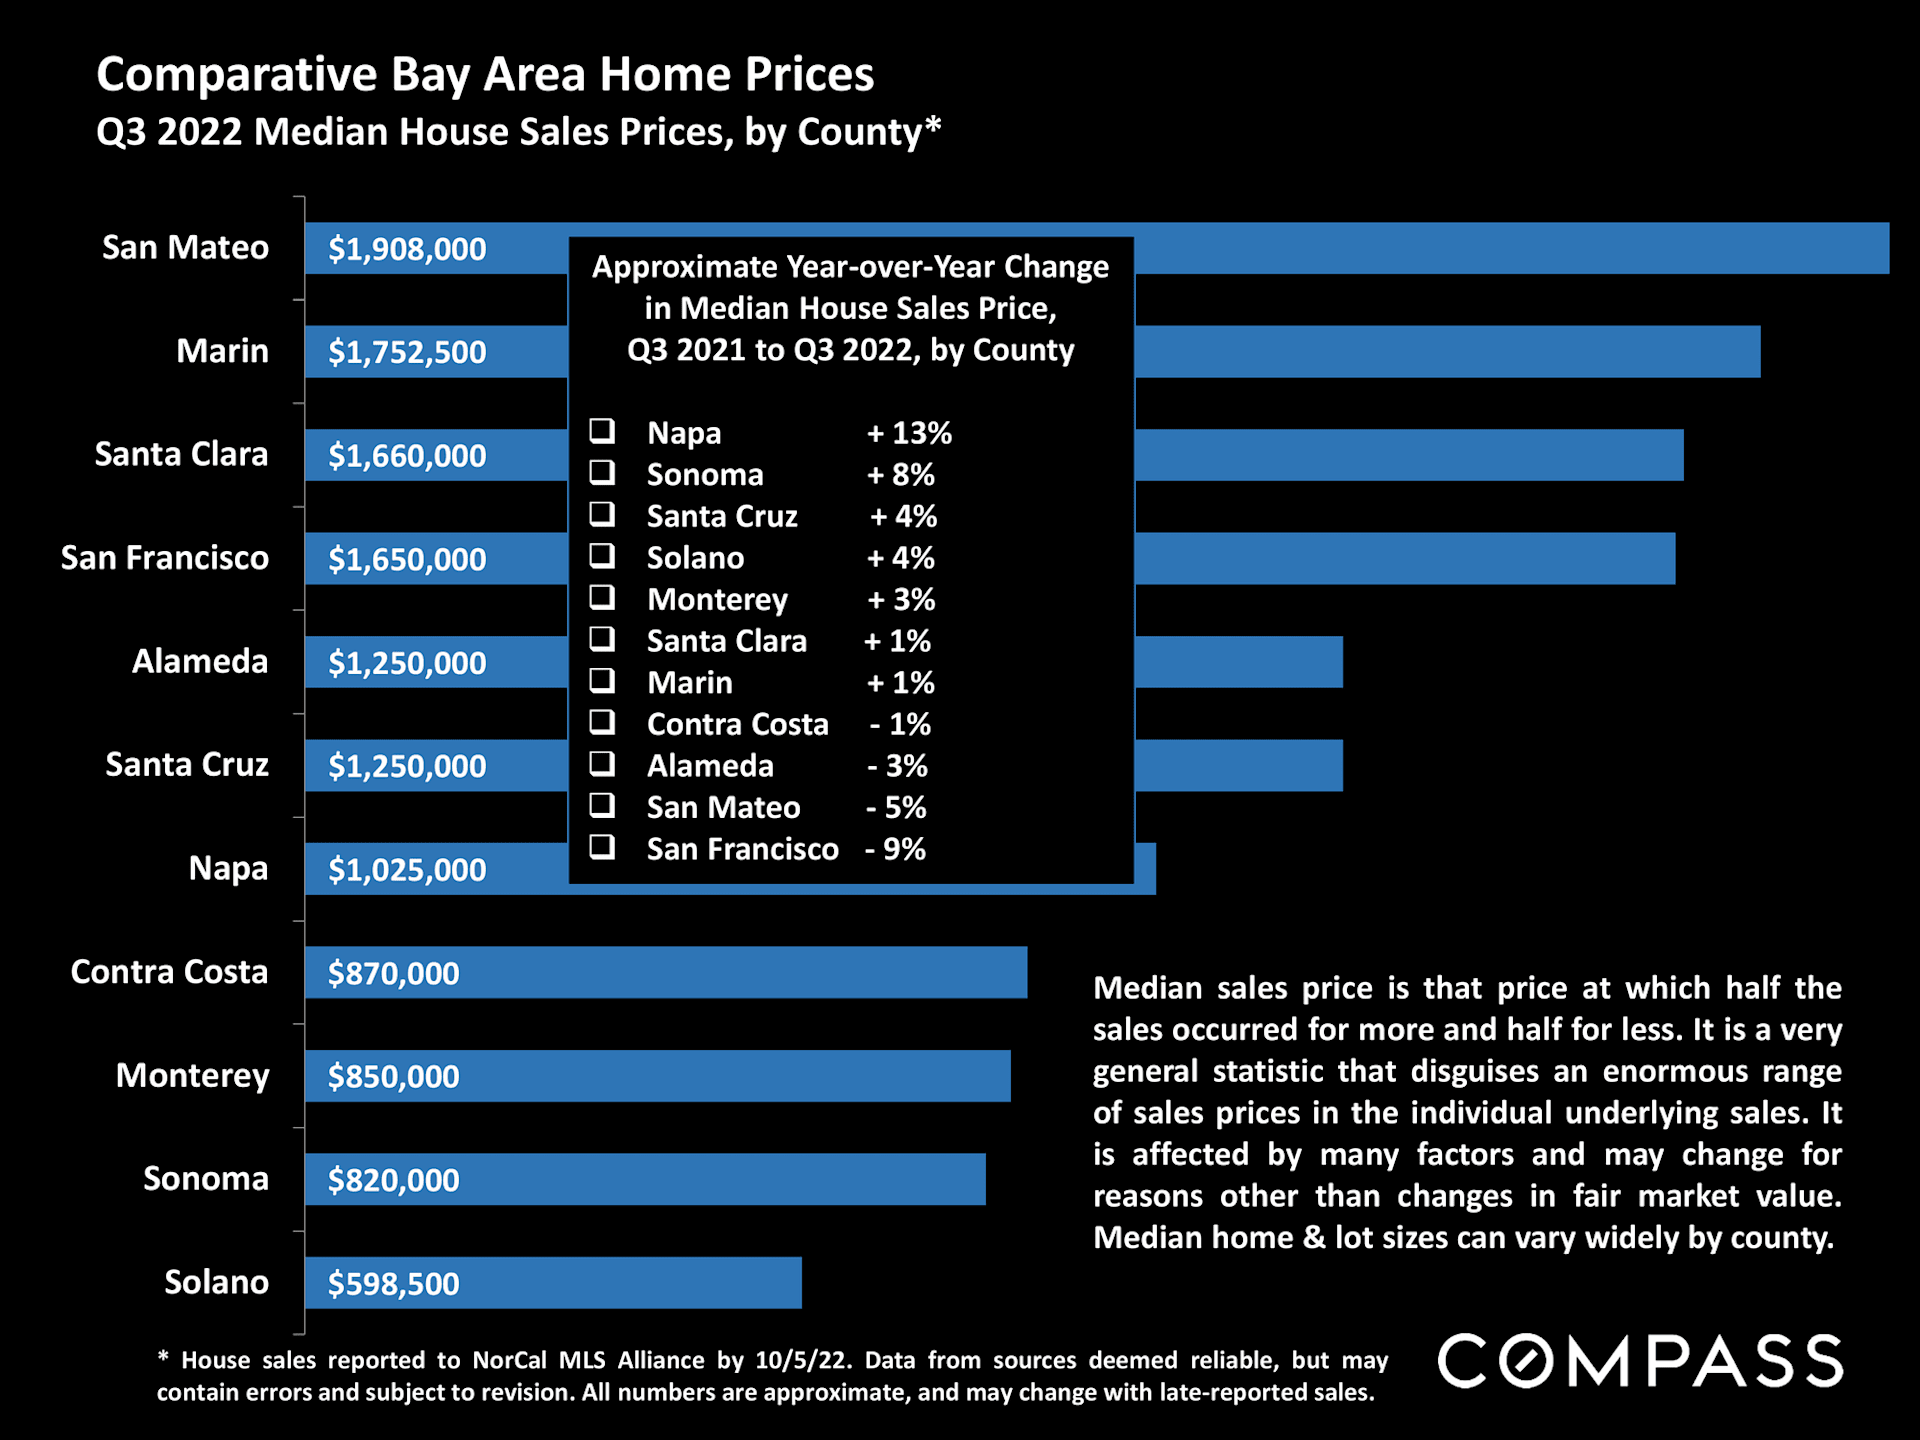
Bay Area county home price chart: Sonoma median sale price $820,000, up 8% year over year in Q3 2022.
 
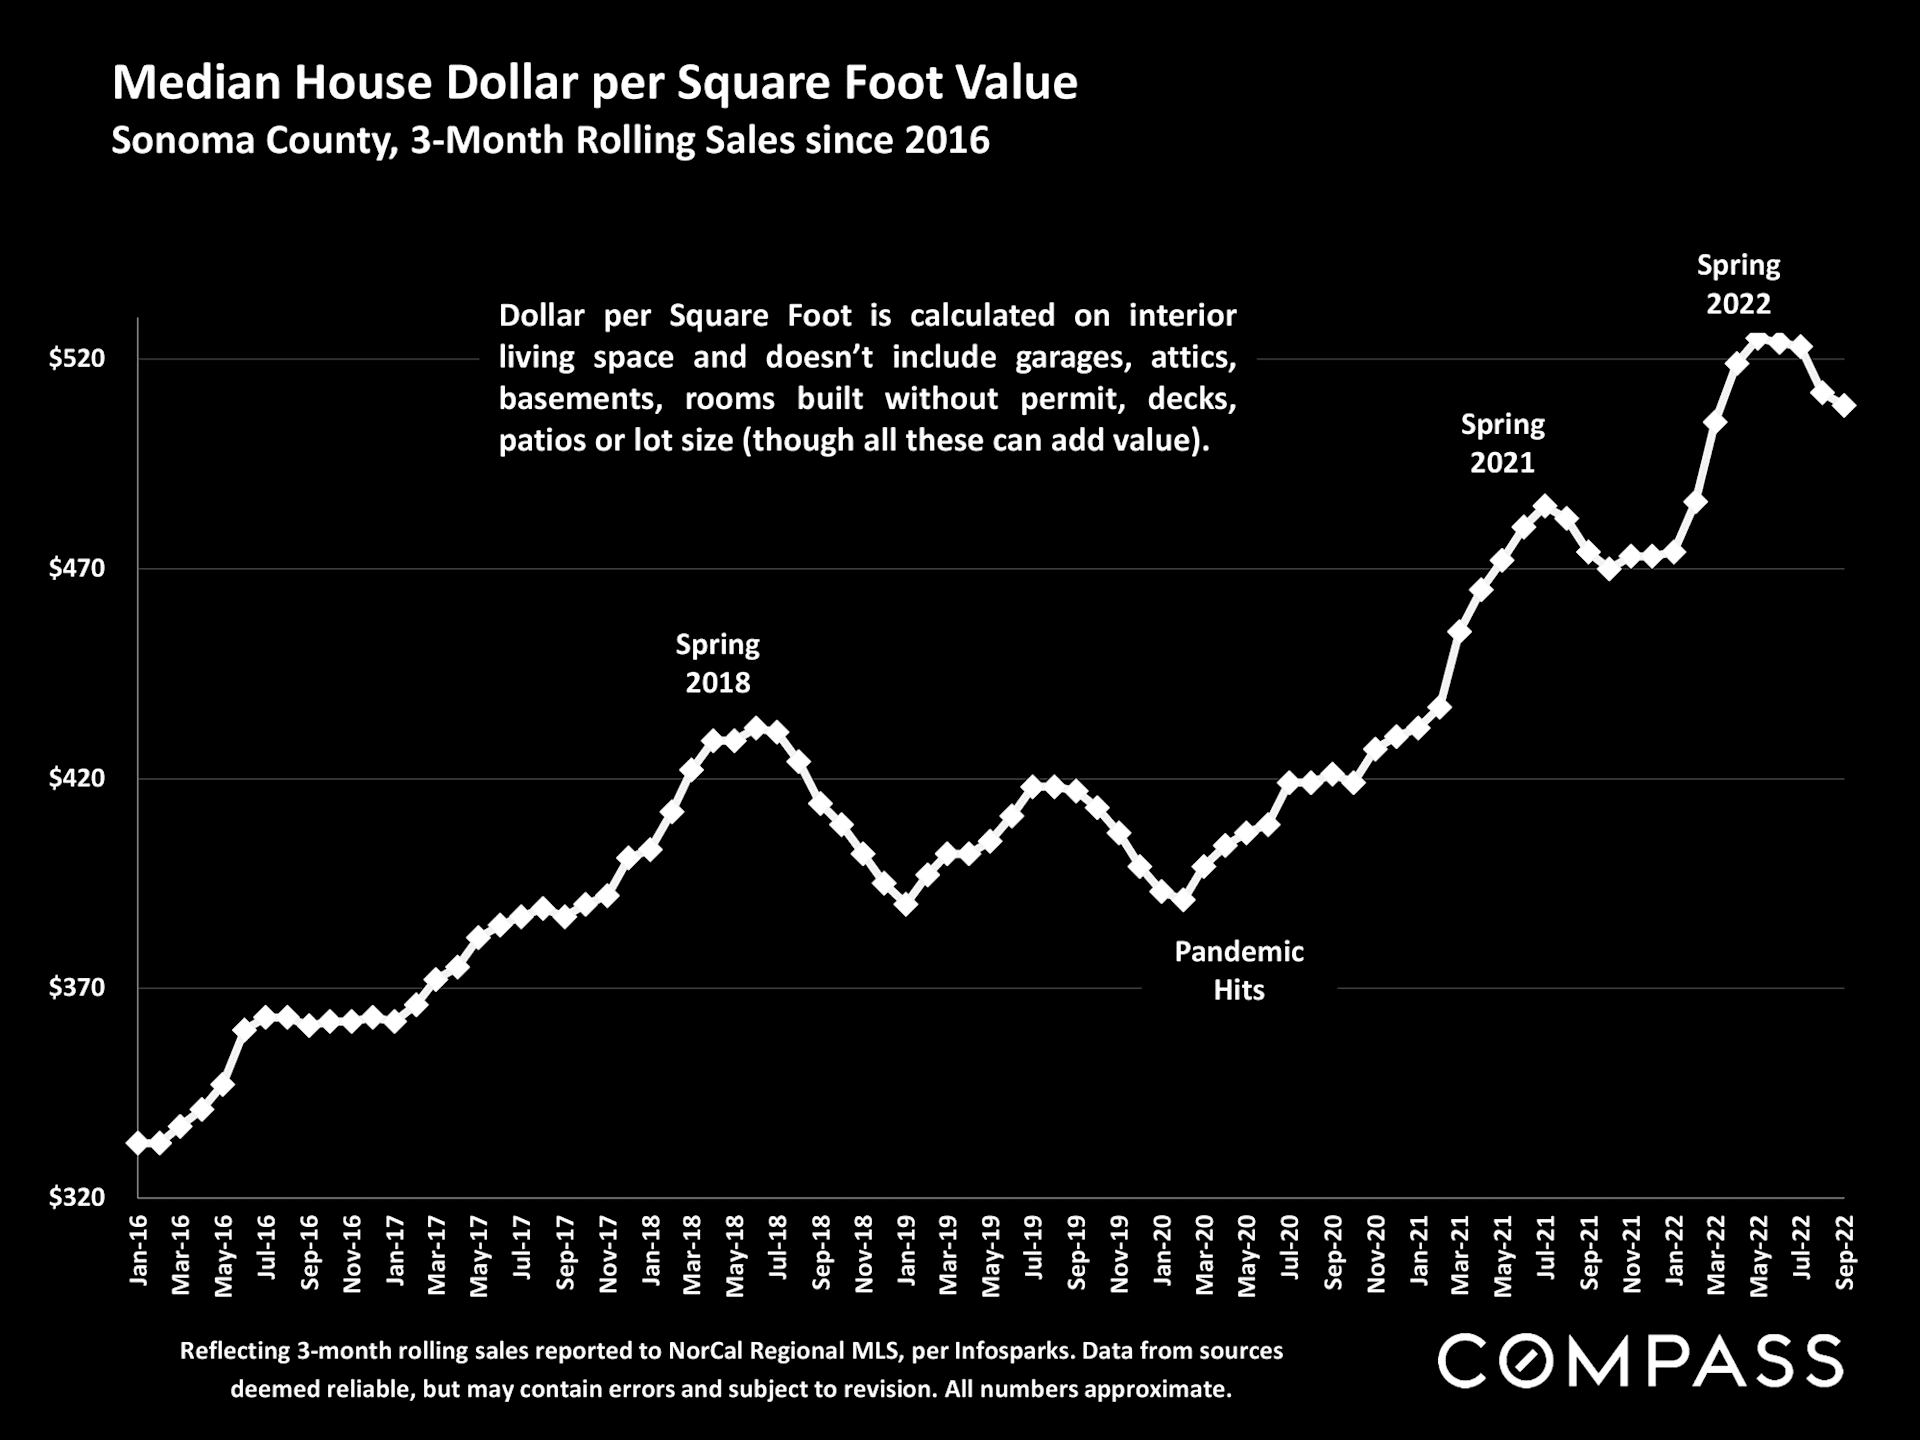
Chart showing Sonoma County median house dollar-per-square-foot values rising overall from 2016 through 2022.
 
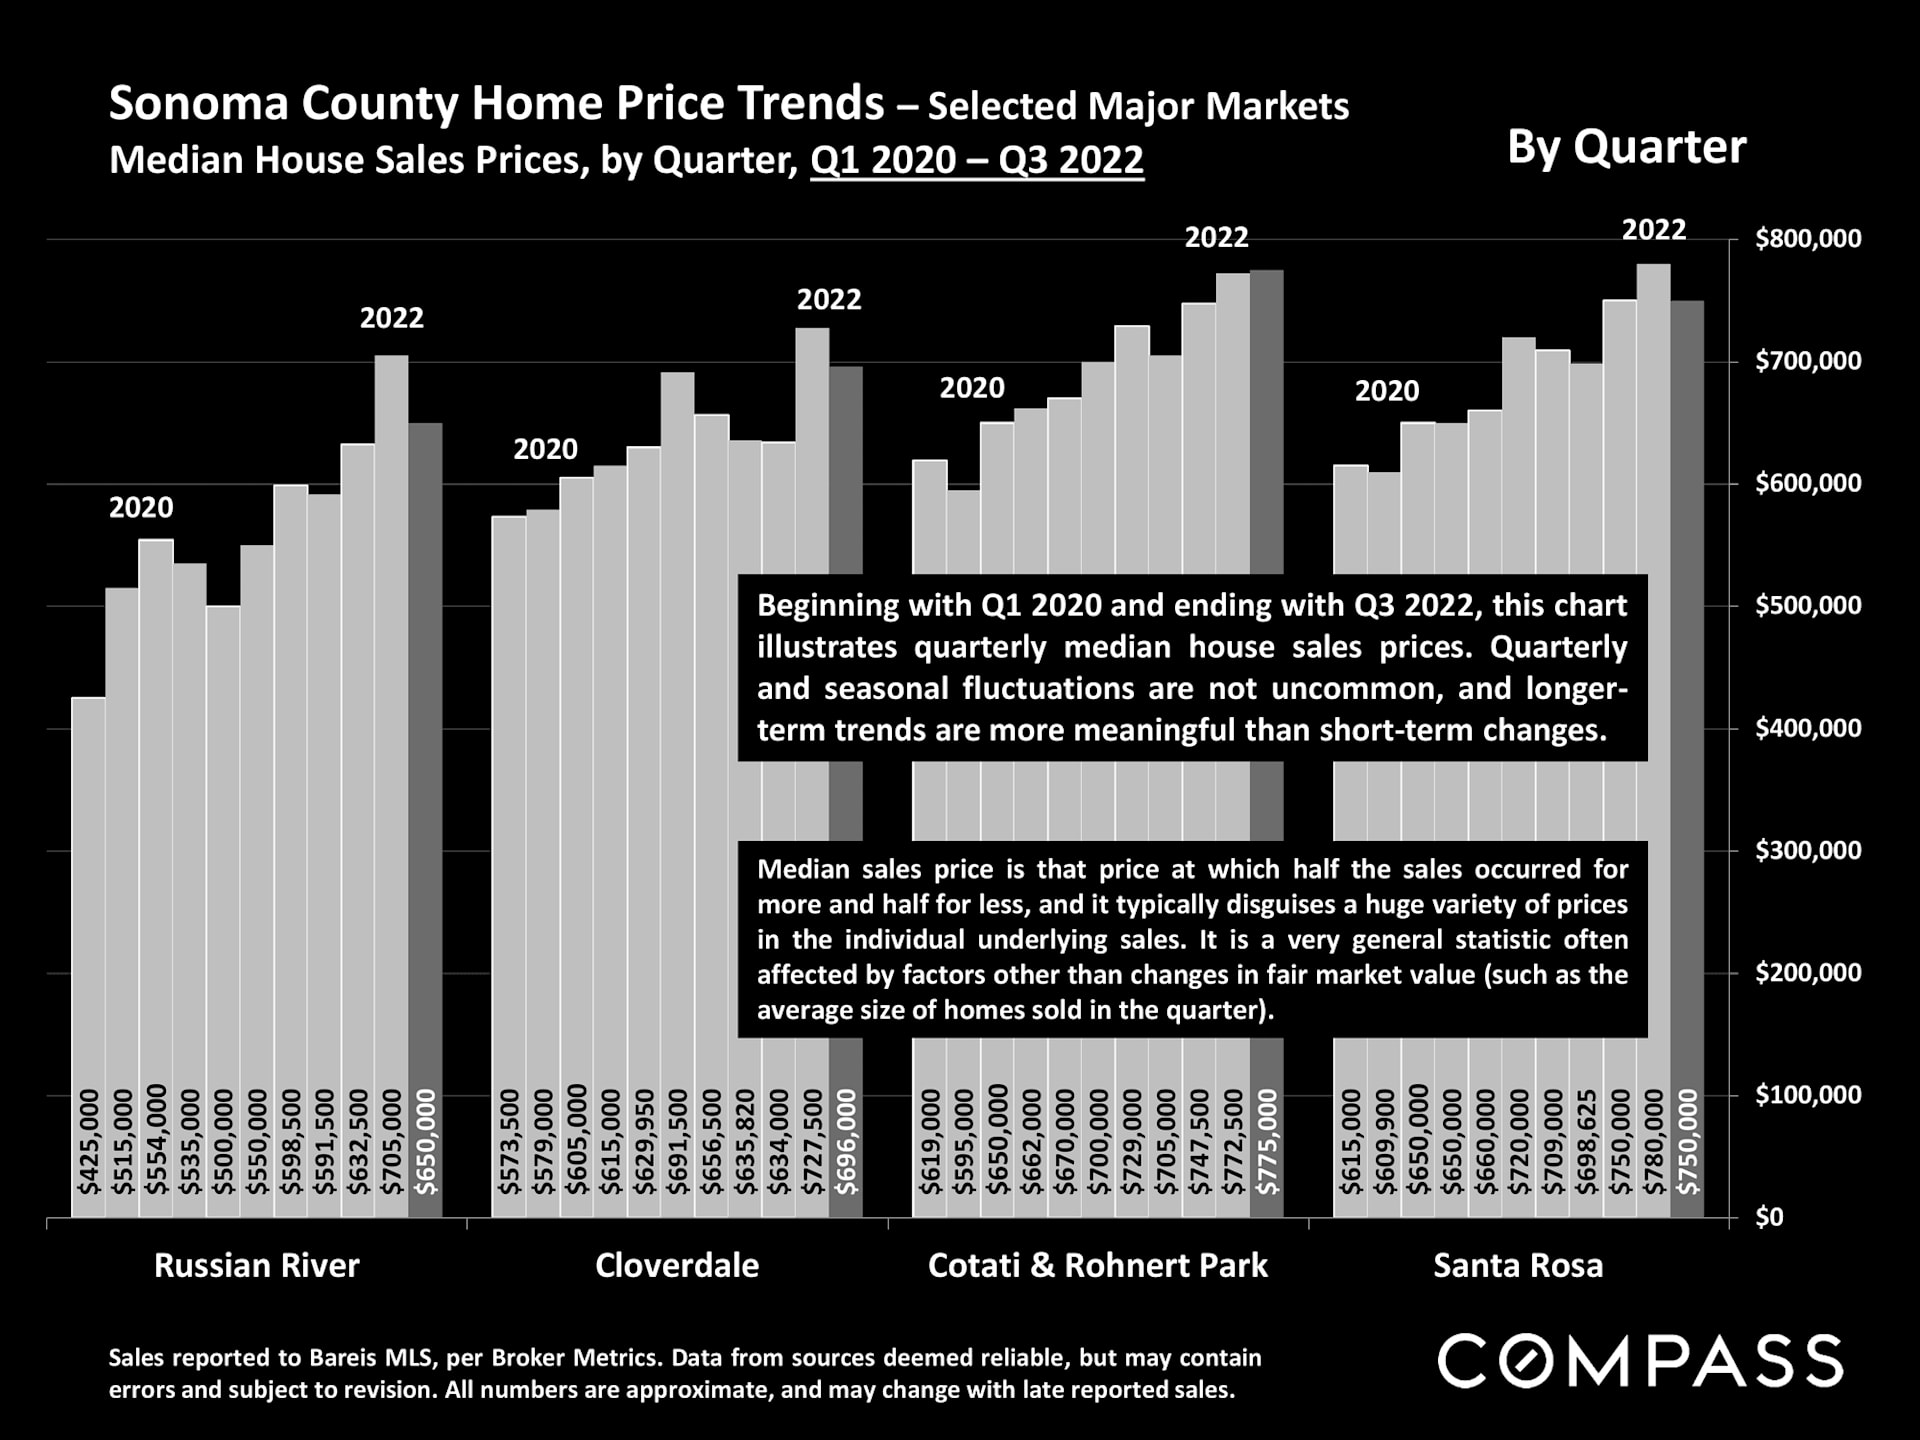
Chart comparing quarterly median home sale prices in four Sonoma County markets from 2020 to 2022.
 
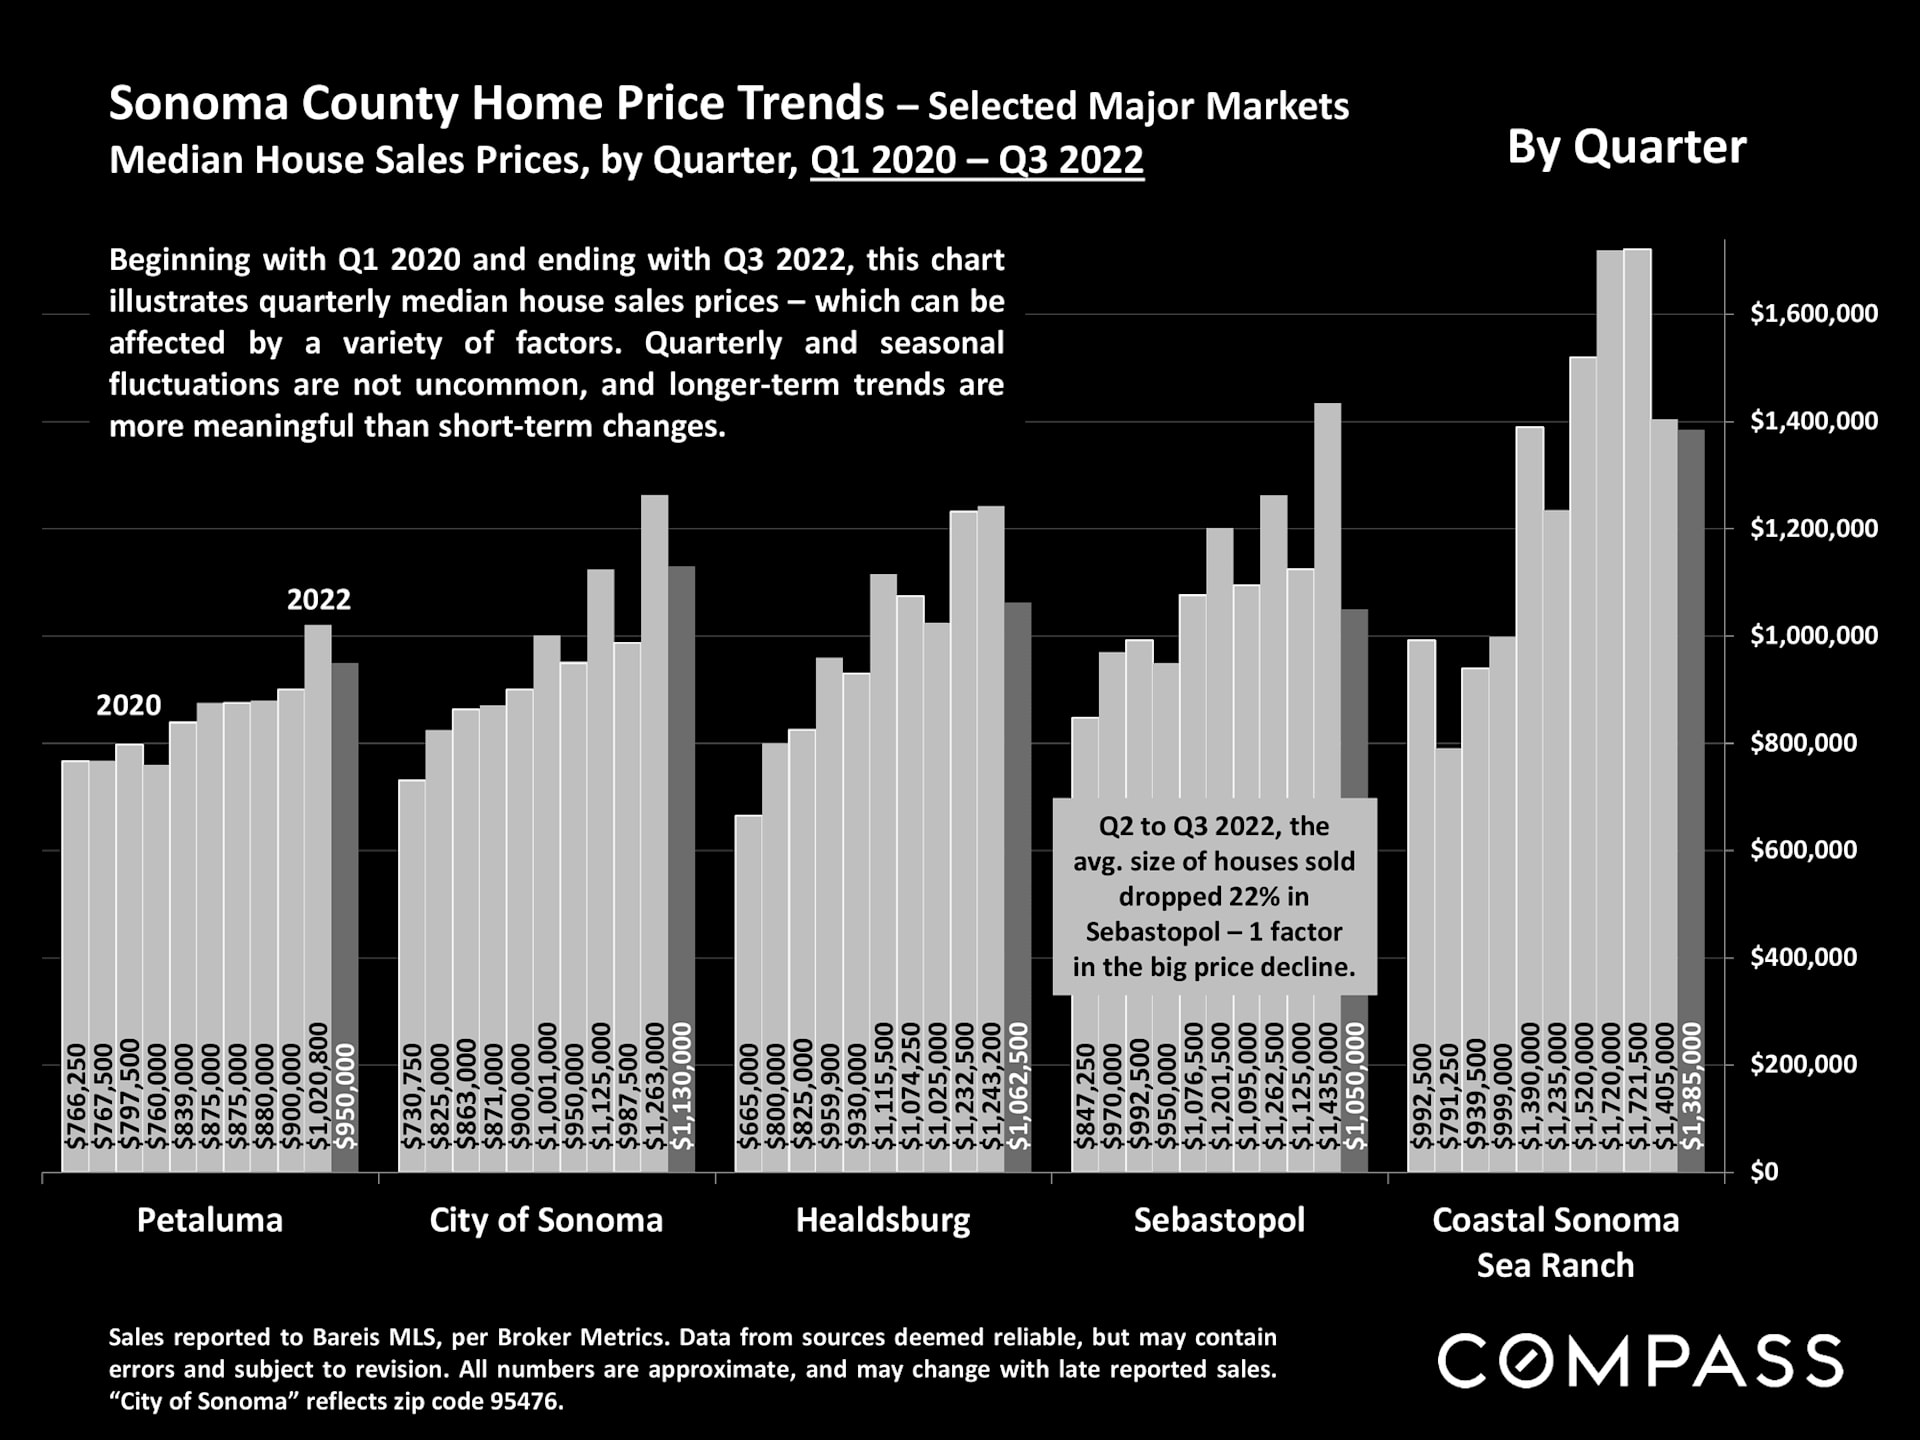
Chart of quarterly median home prices in five Sonoma County markets from Q1 2020 to Q3 2022.
 
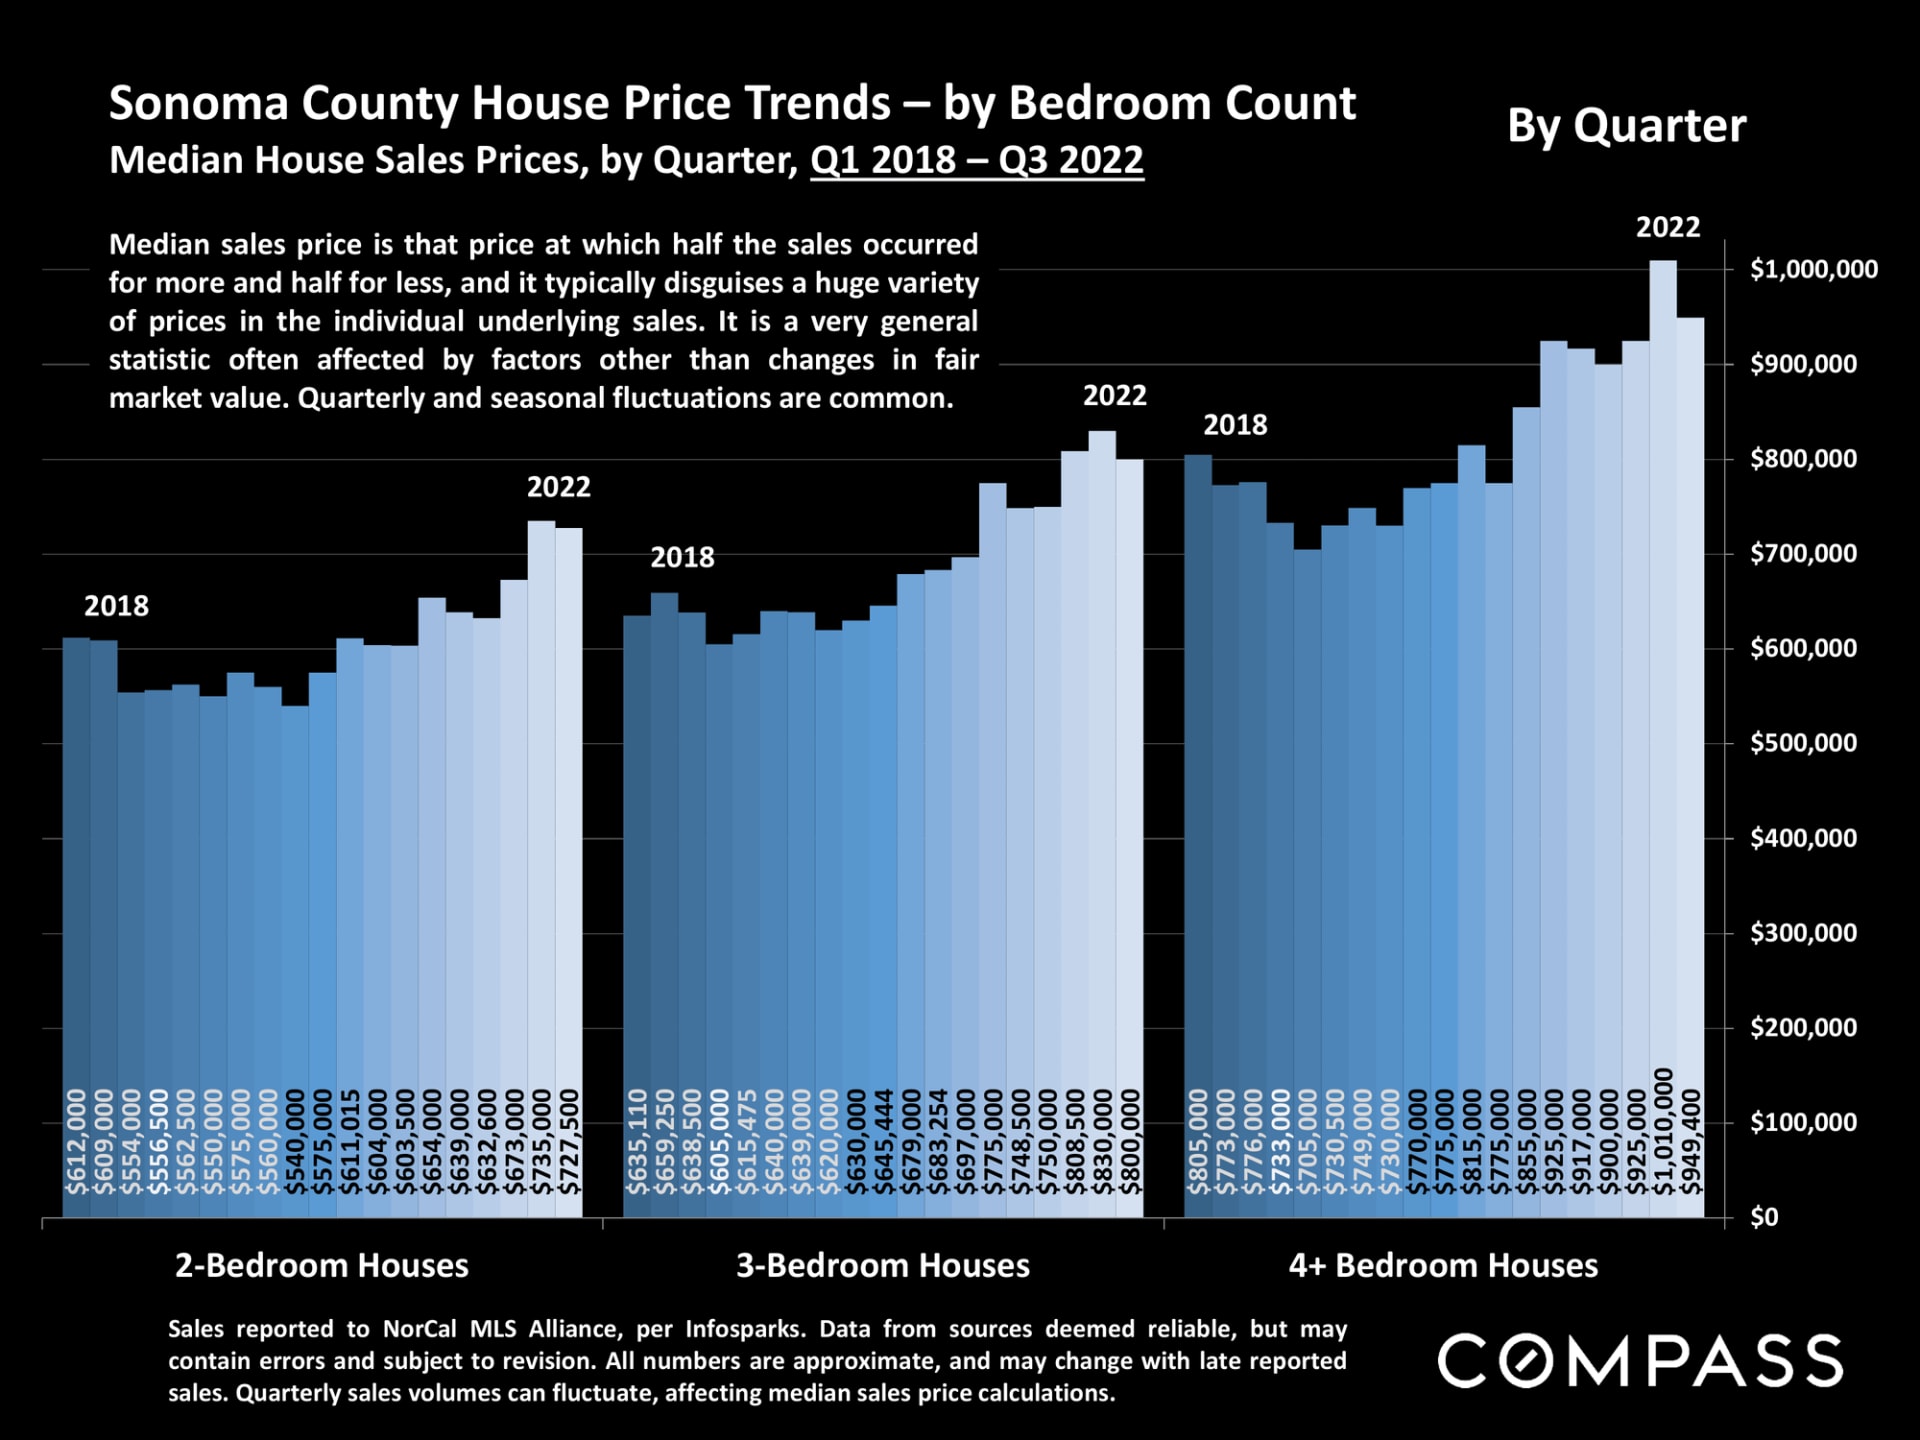
Sonoma County quarterly median house prices by bedroom count, shown in a blue bar chart from 2018 to 2022.
 
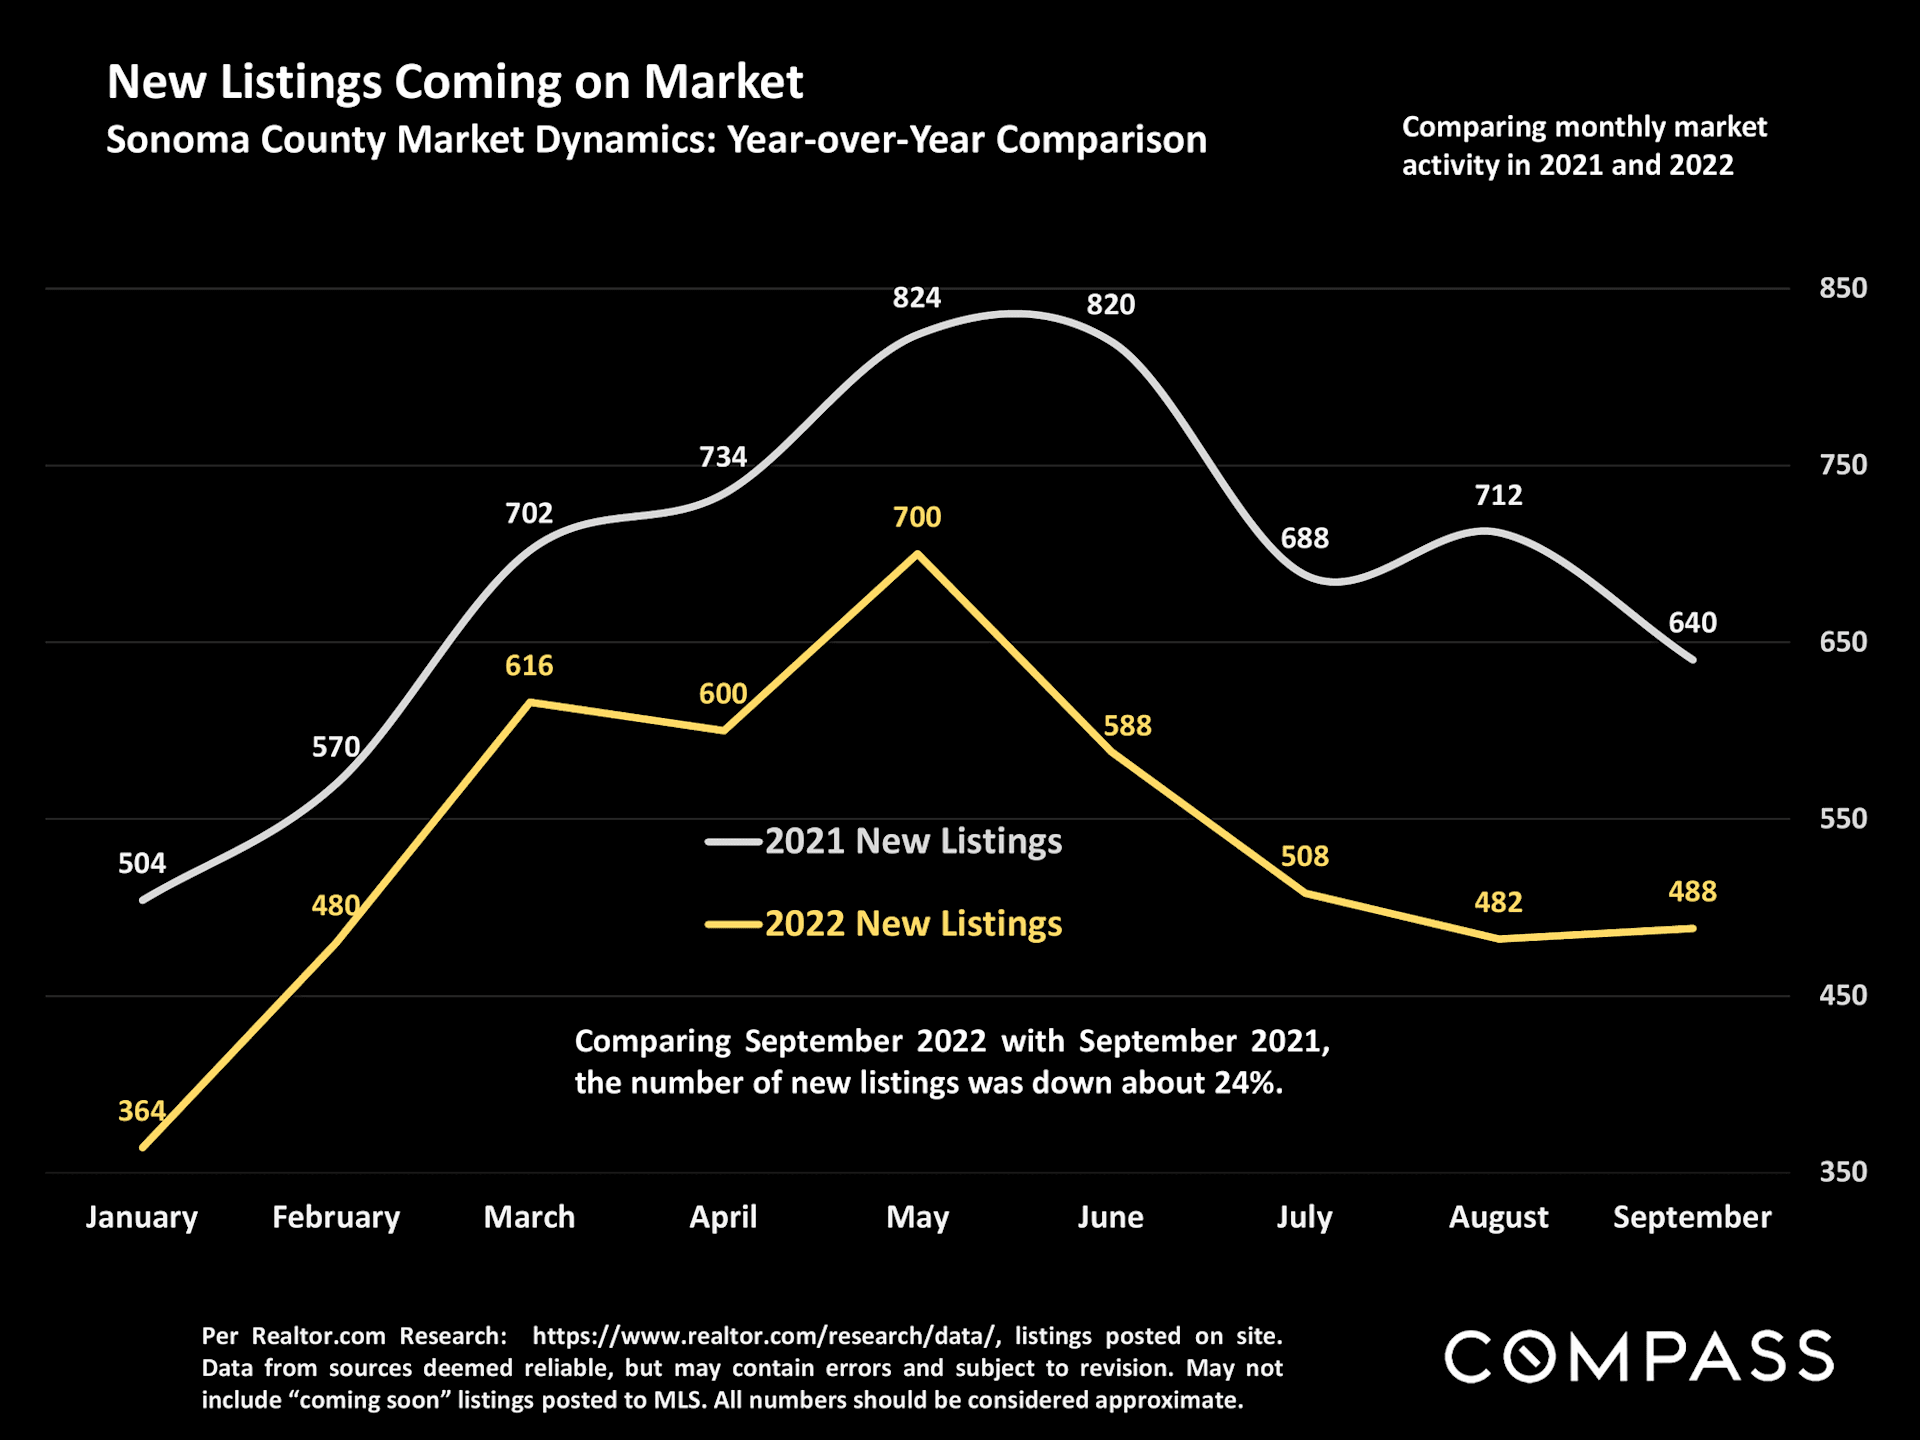
Sonoma County new-listings chart compares 2021 and 2022, with 2022 lower from June onward.
 
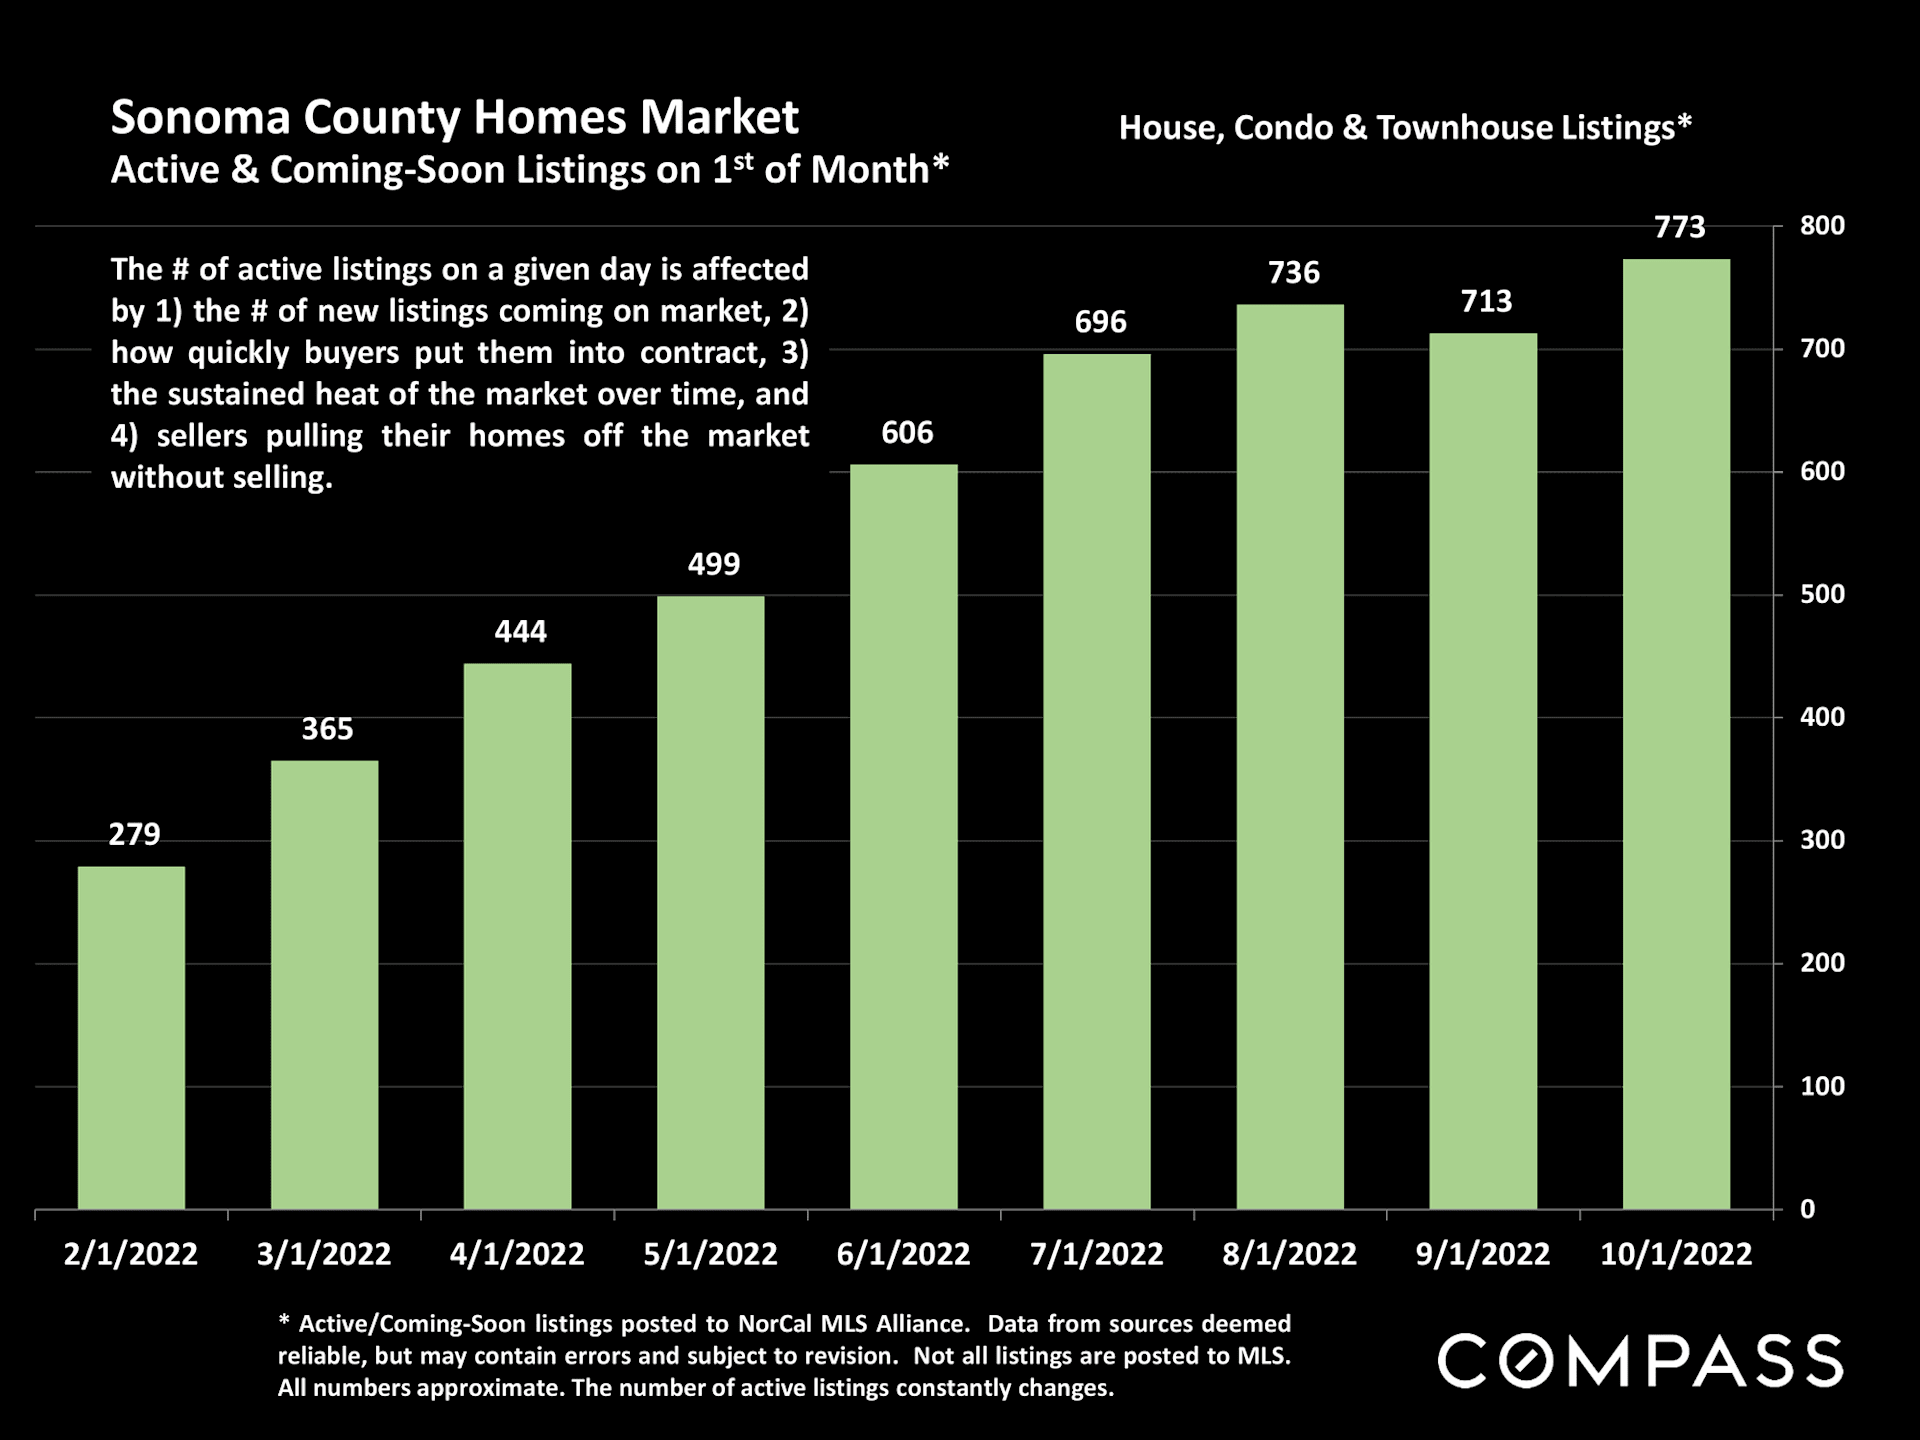
Bar chart of Sonoma County active and coming-soon listings, rising from 279 in February to 773 in October 2022.
 
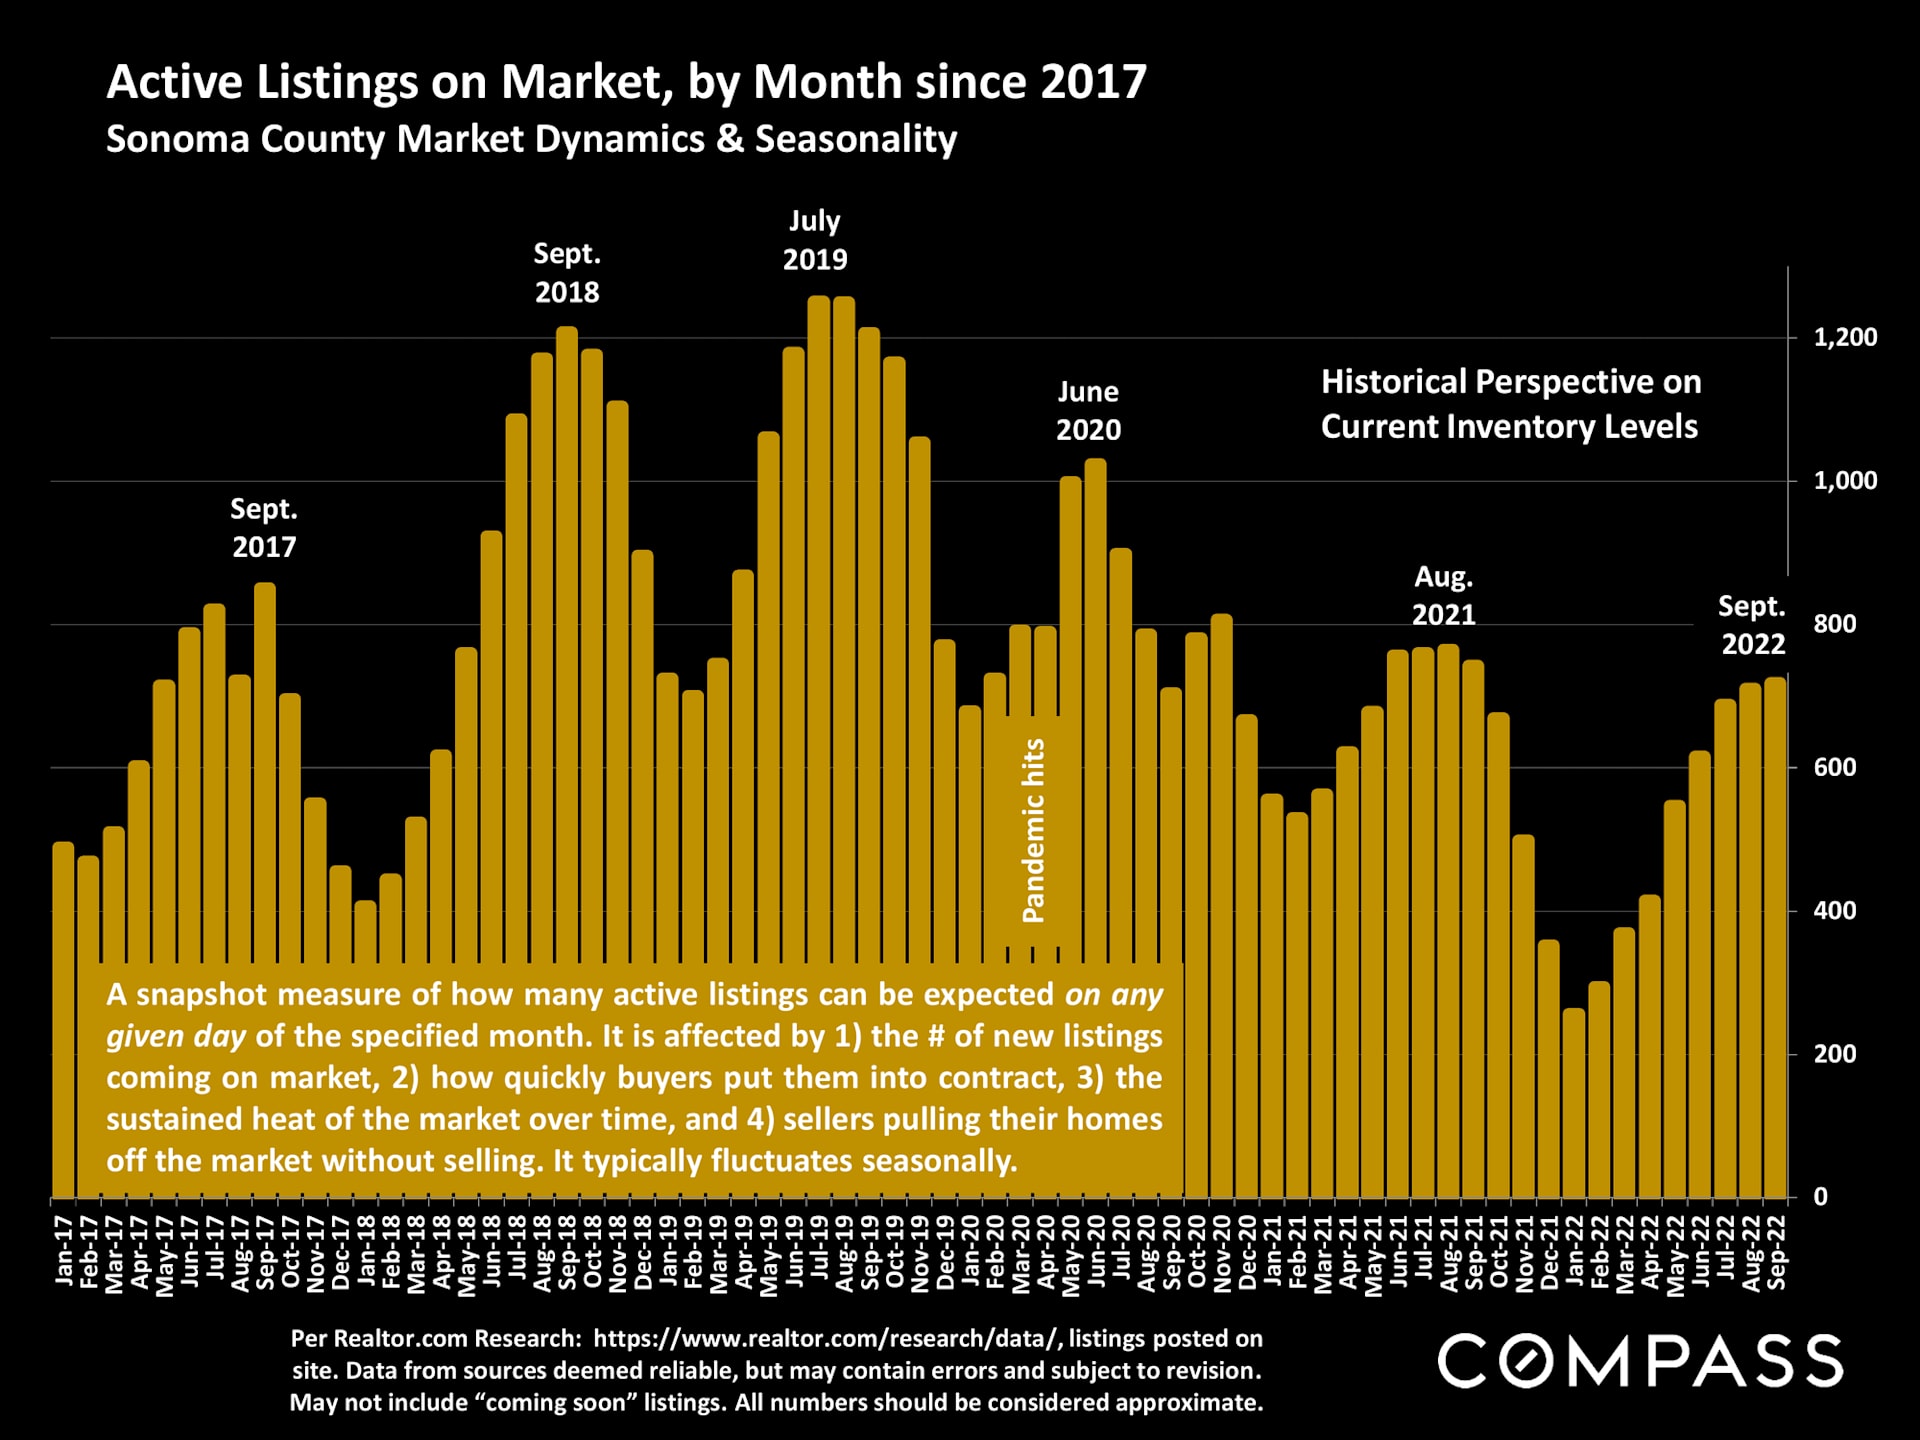
Chart of monthly active listings in Sonoma County from 2017 to 2022, highlighting seasonal peaks and pandemic-era inventory.
 
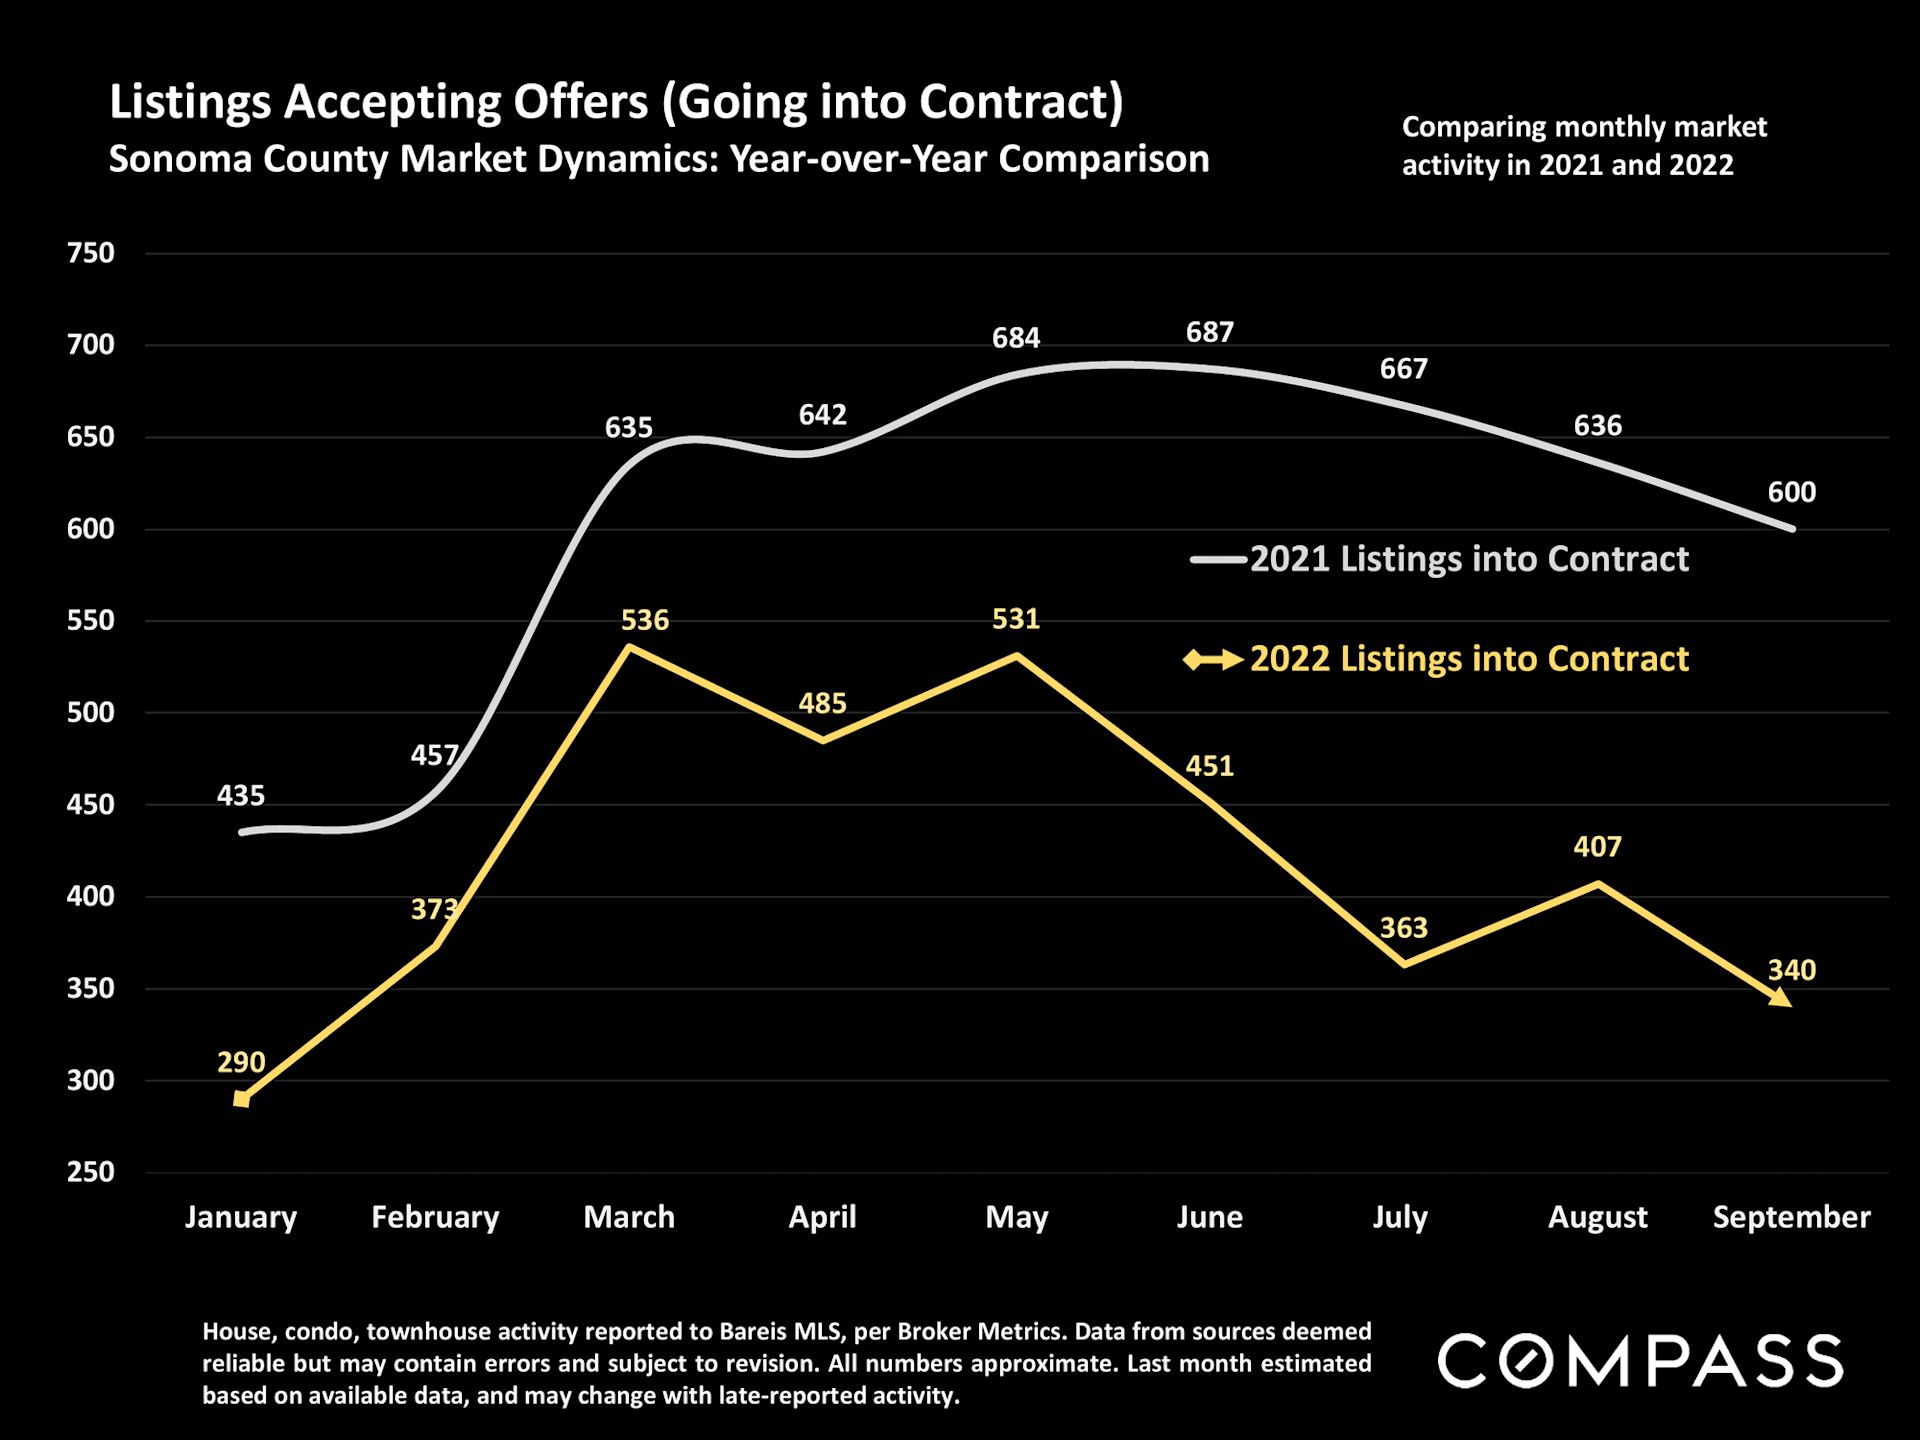
Chart comparing Sonoma County listings going into contract each month in 2021 and 2022.
 
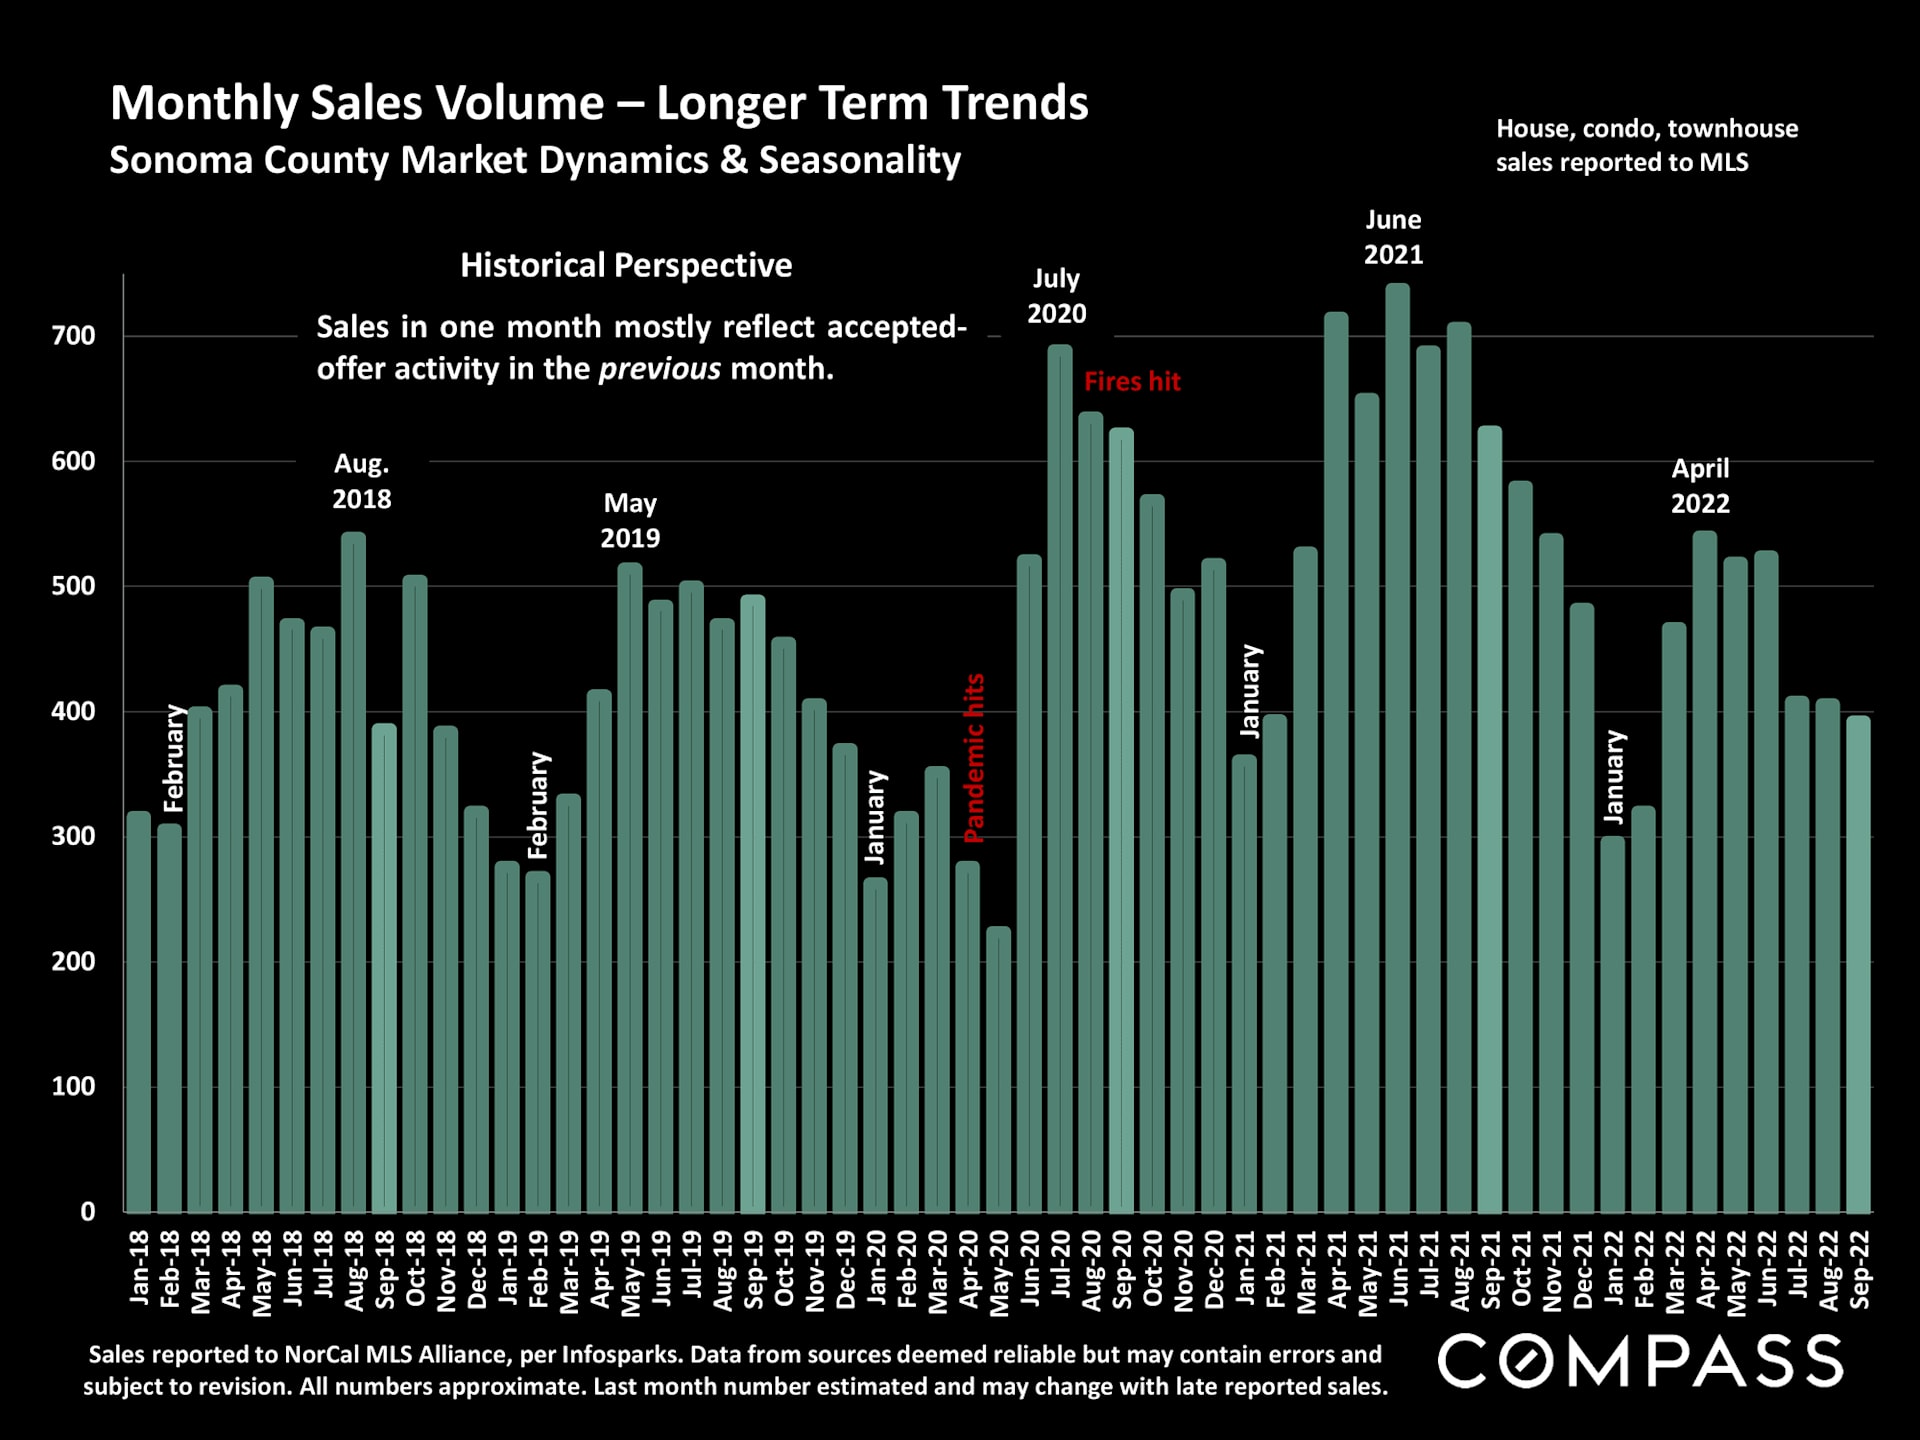
Chart of Sonoma County monthly home sales from 2018 to 2022, with pandemic and fire annotations.
 
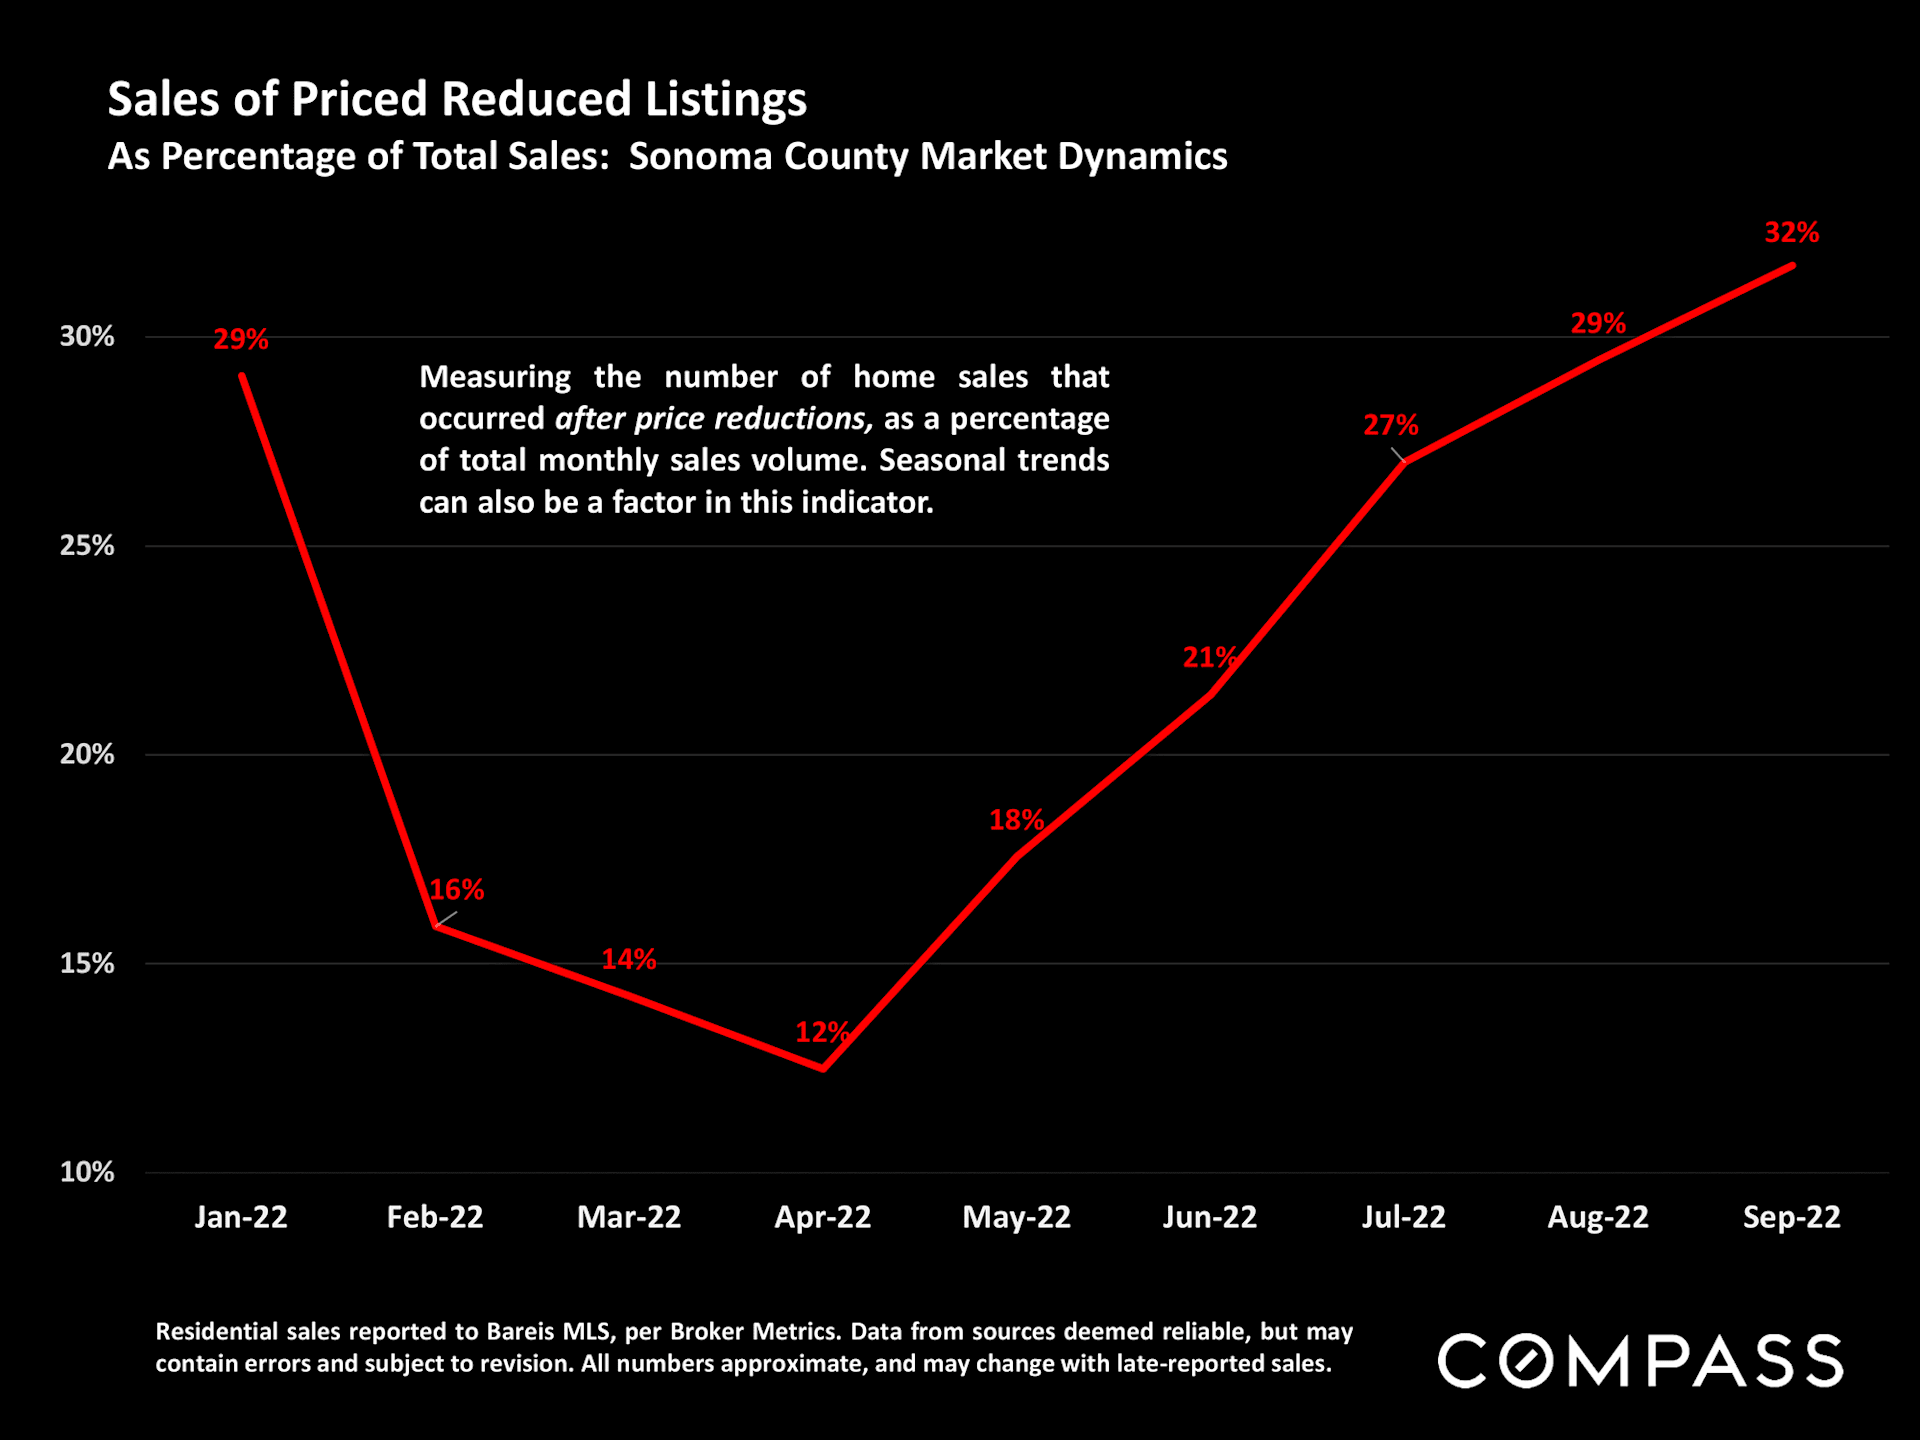
Chart of Sonoma County sales after price reductions, falling to 12% in April 2022 before rising to 32% in September.
 
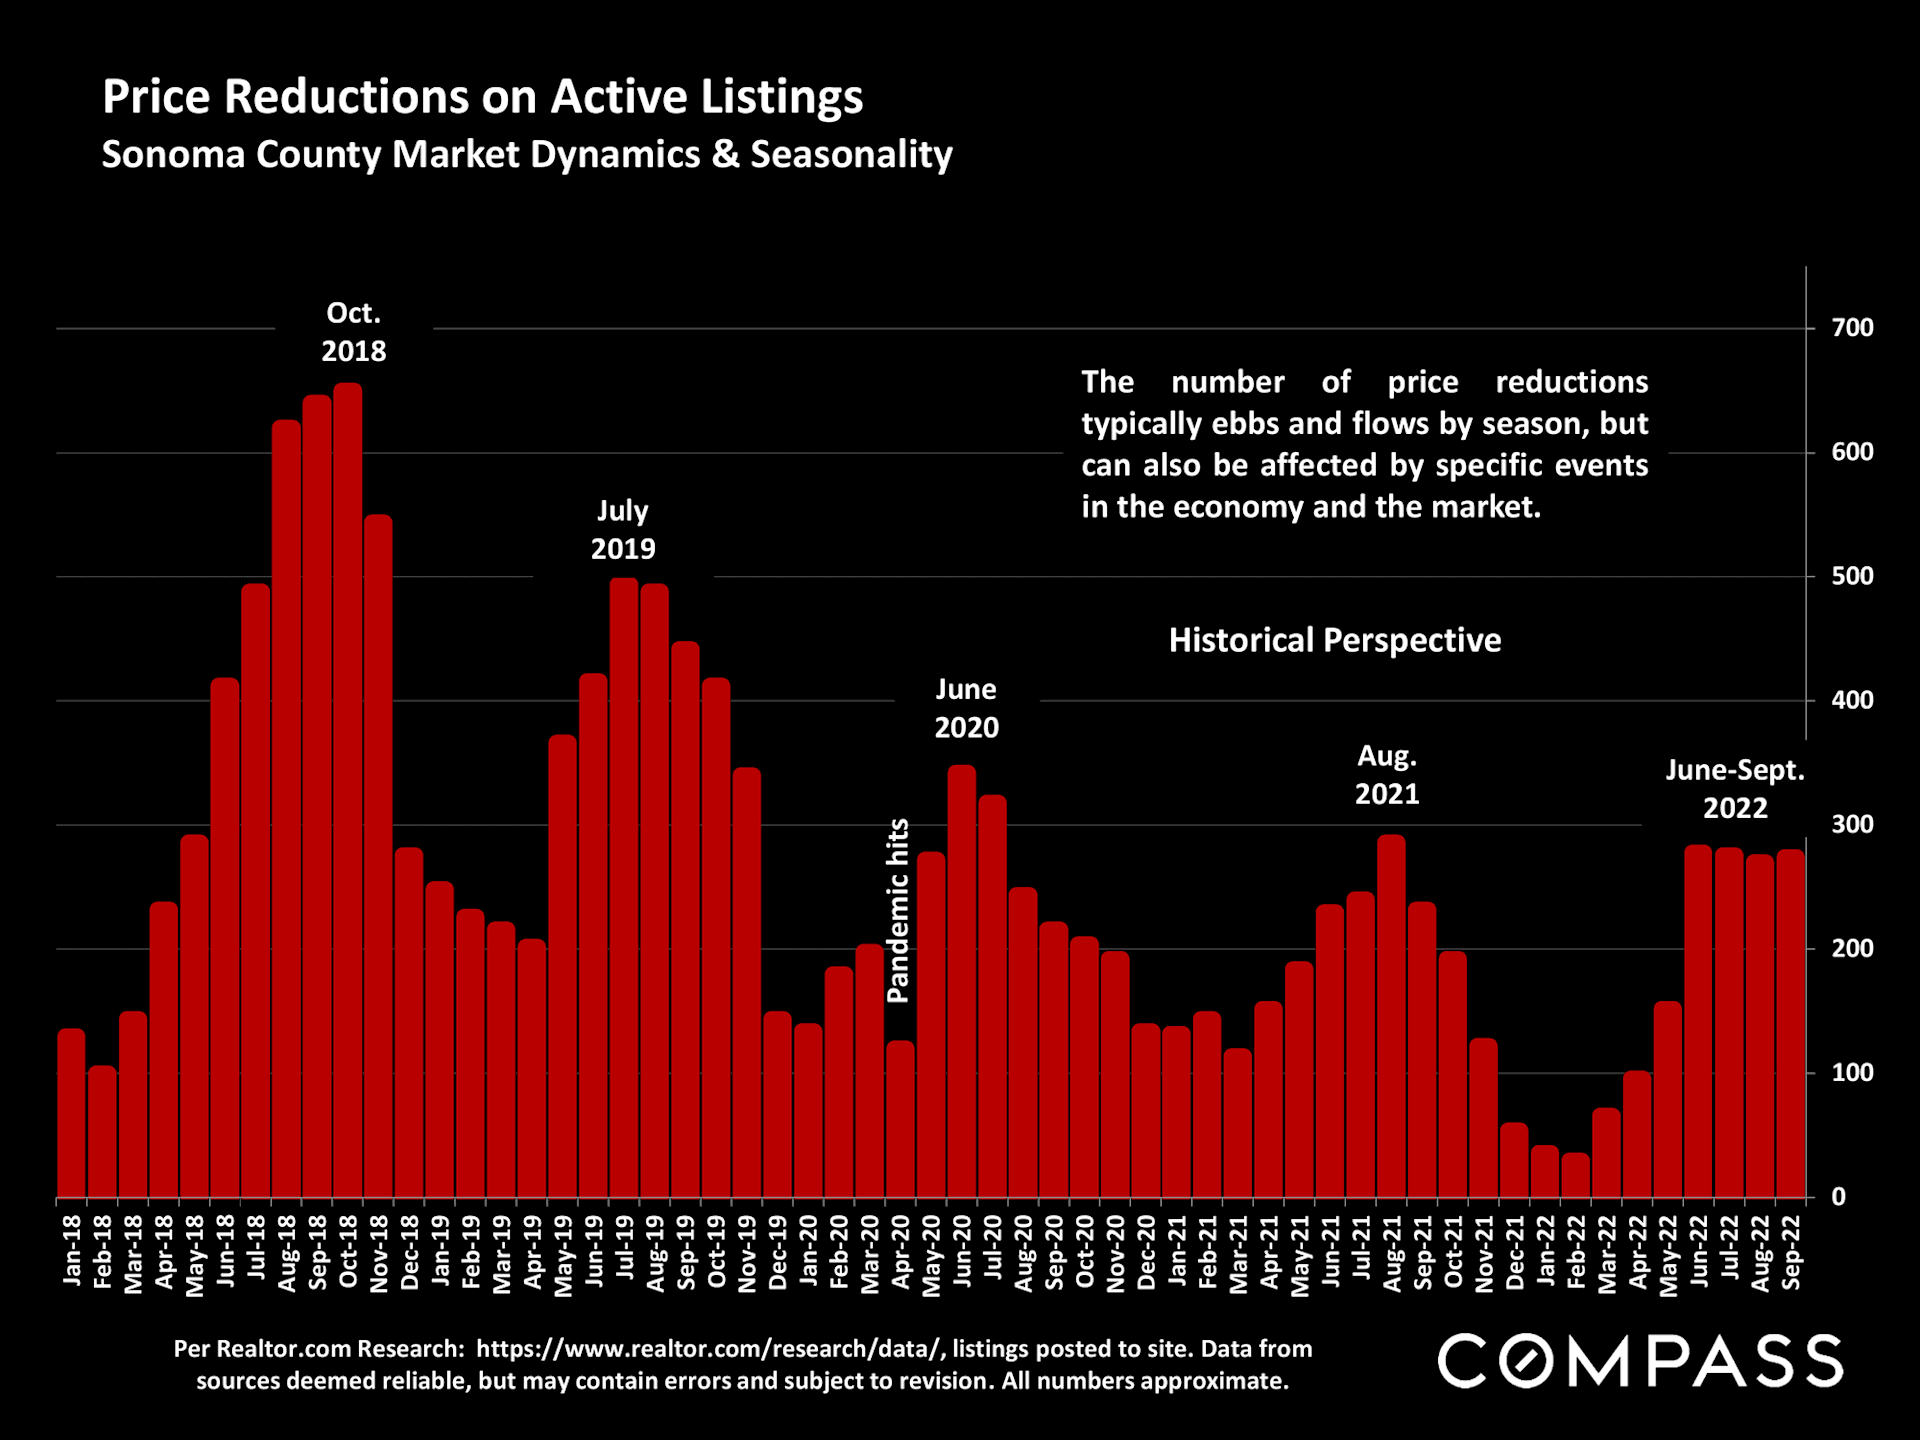
Bar chart of Sonoma County active-listing price reductions from January 2018 to September 2022.
 
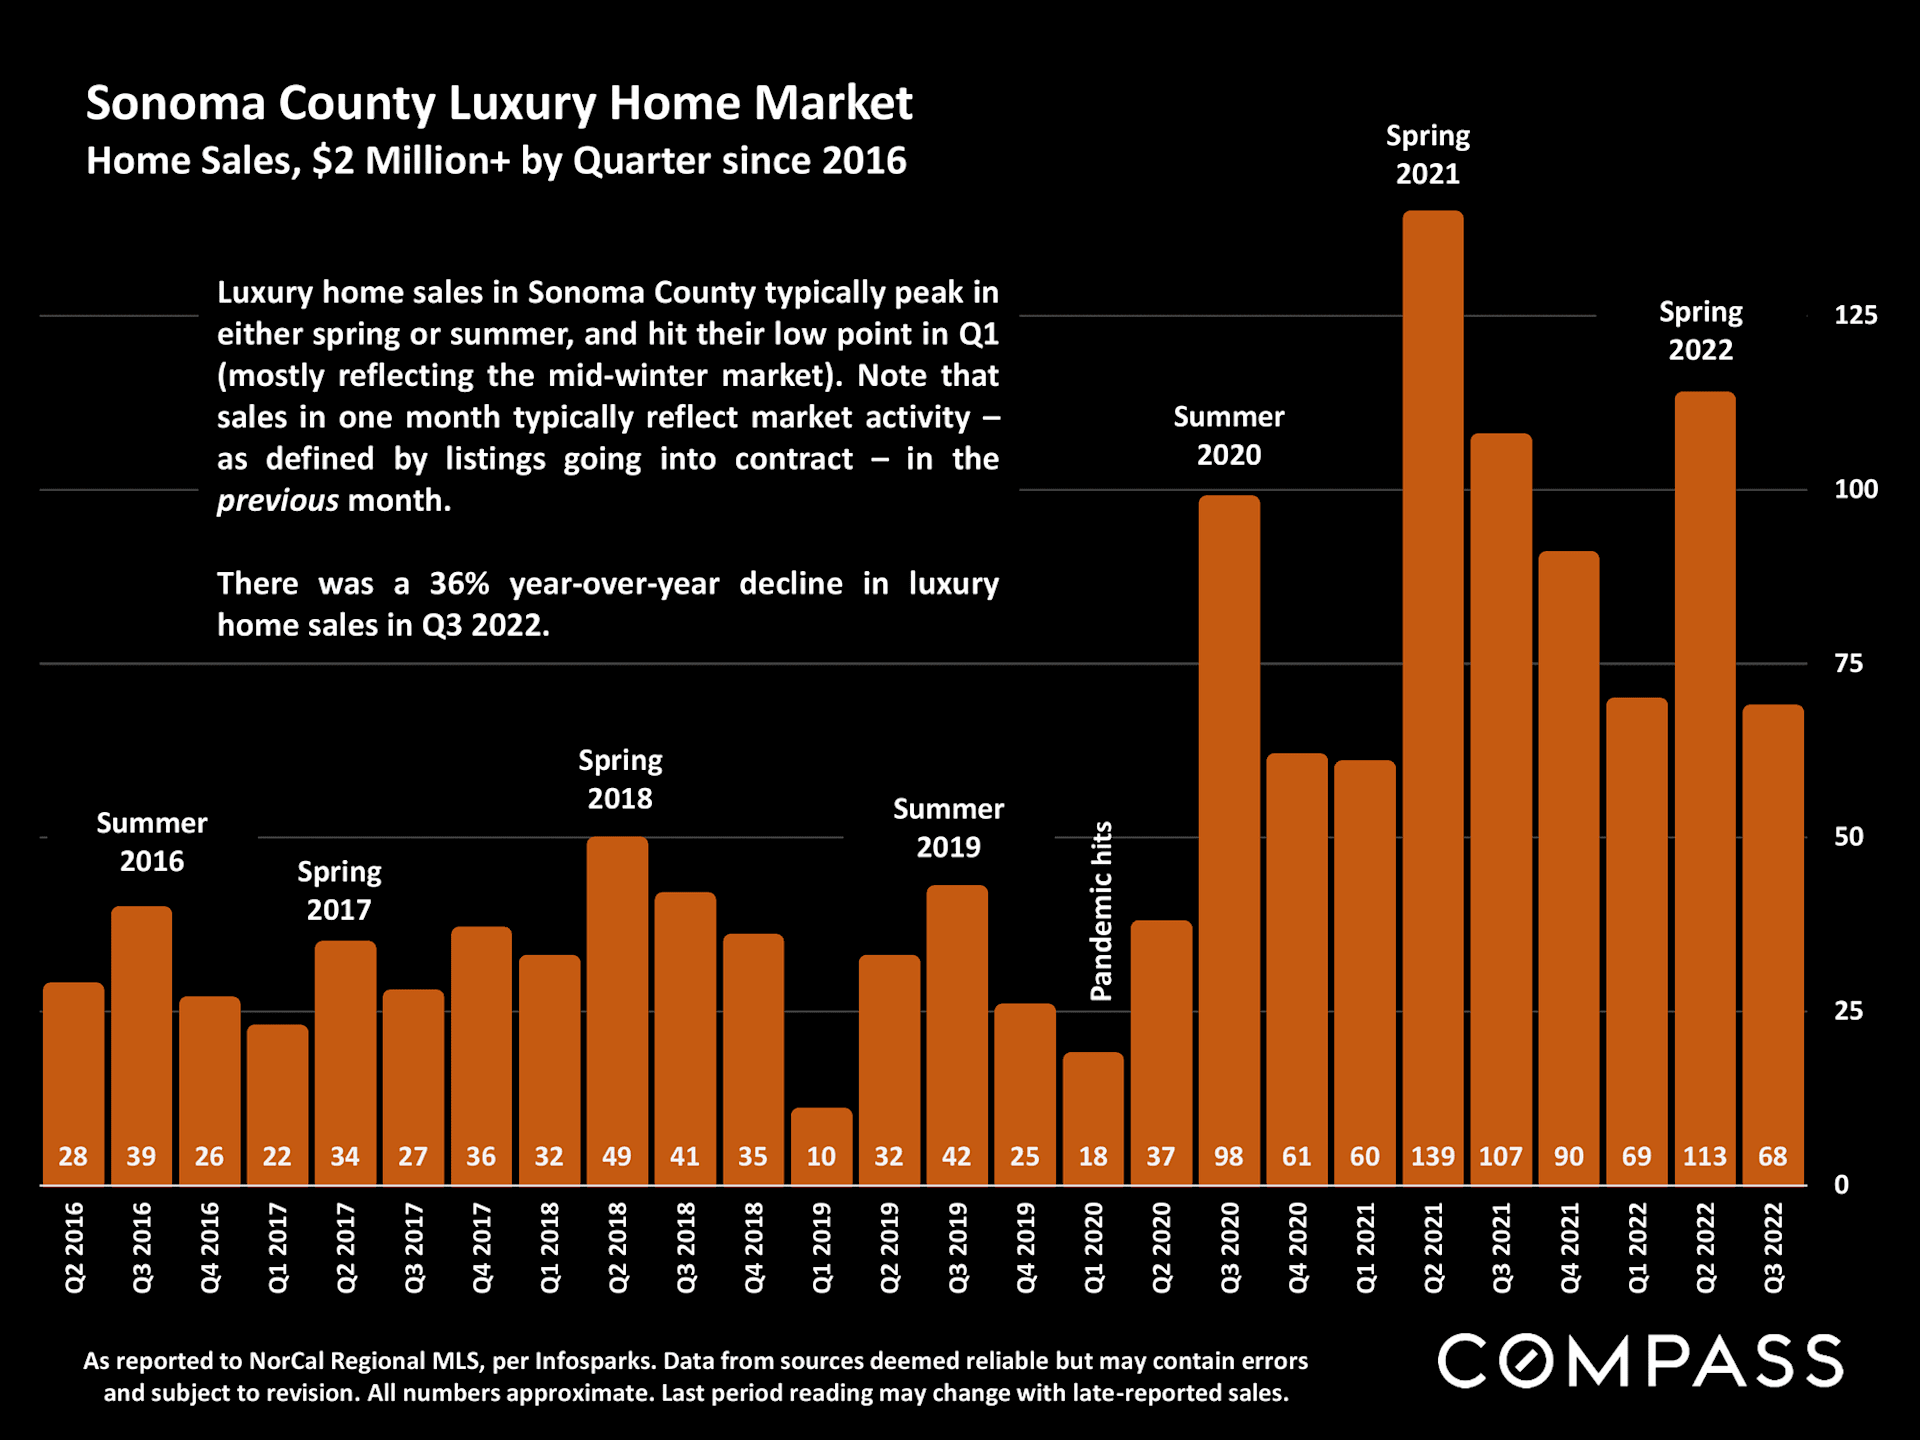
Chart of Sonoma County luxury home sales over $2 million by quarter, Q2 2016–Q3 2022.
 
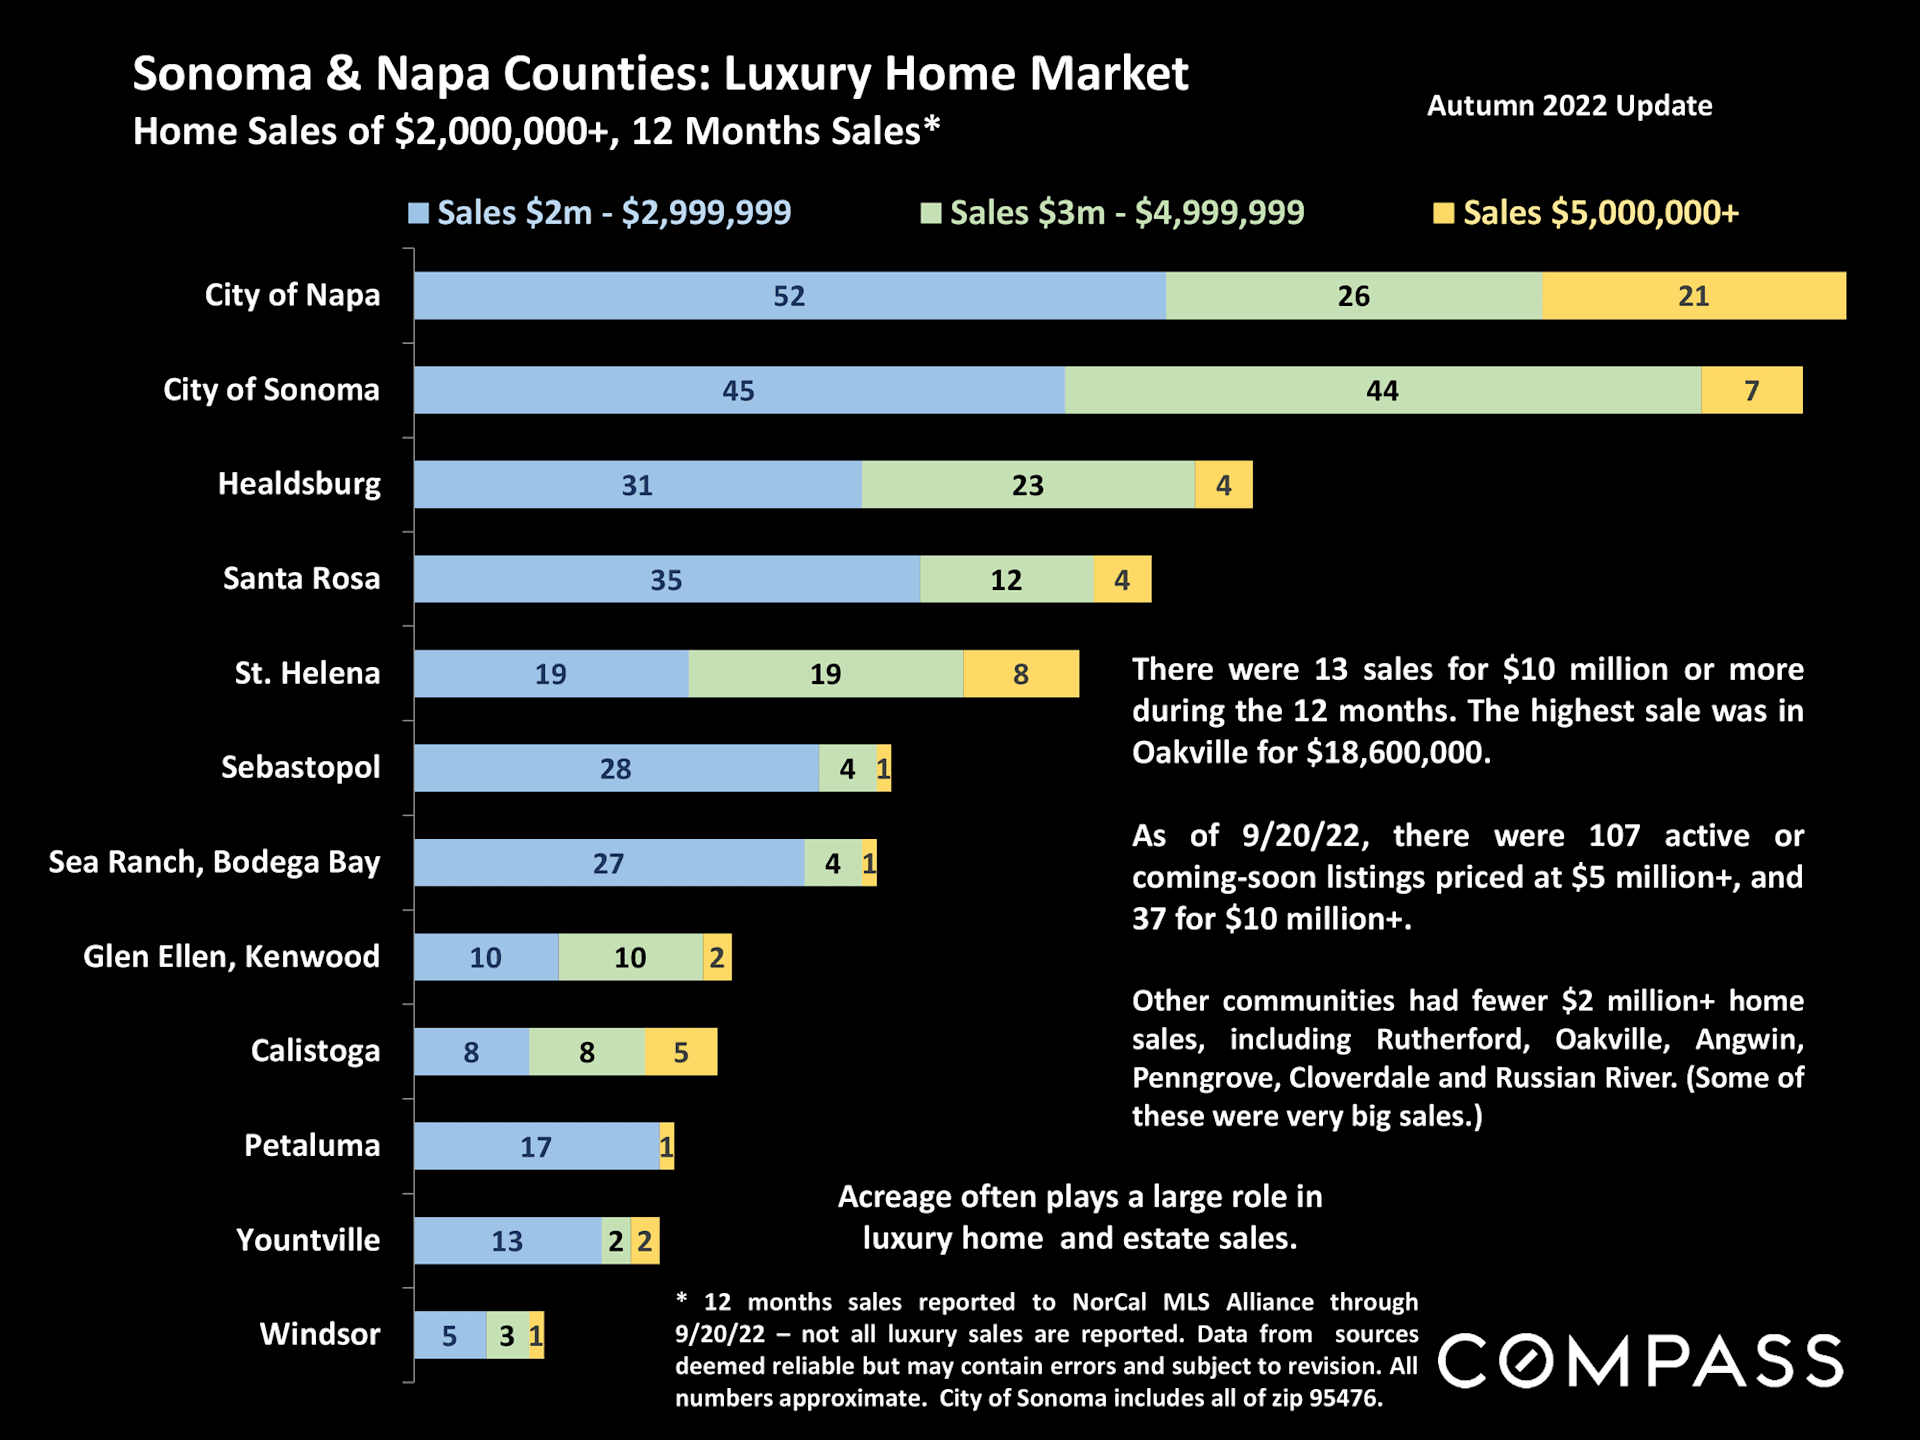
Bar chart compares $2 million-plus luxury home sales across Sonoma and Napa County communities.
 
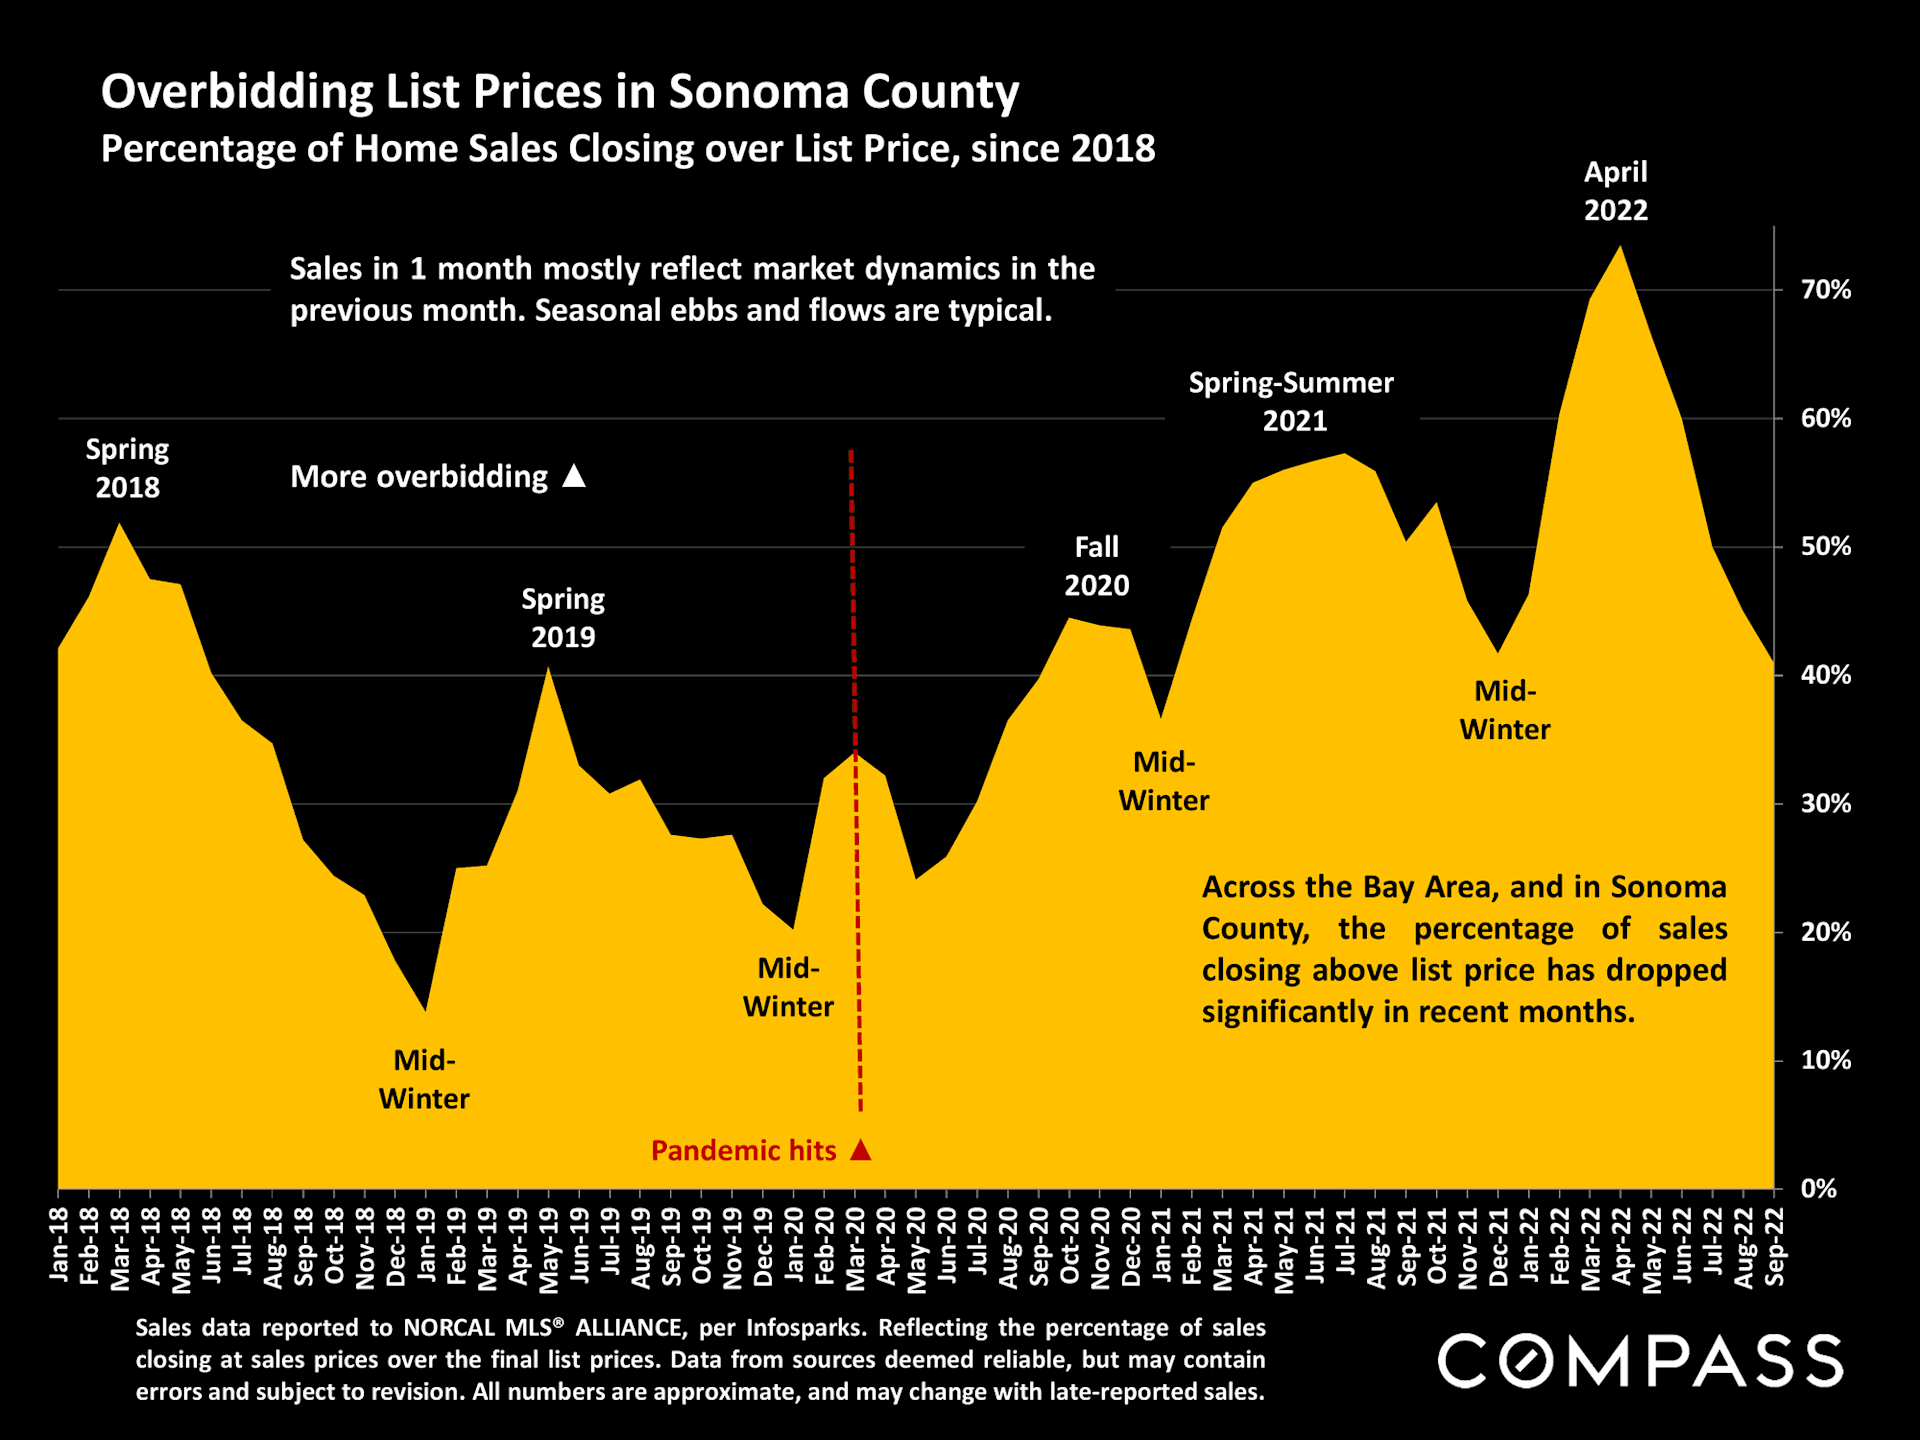
Chart of Sonoma County home sales over list price, peaking in April 2022 before declining through September.
 
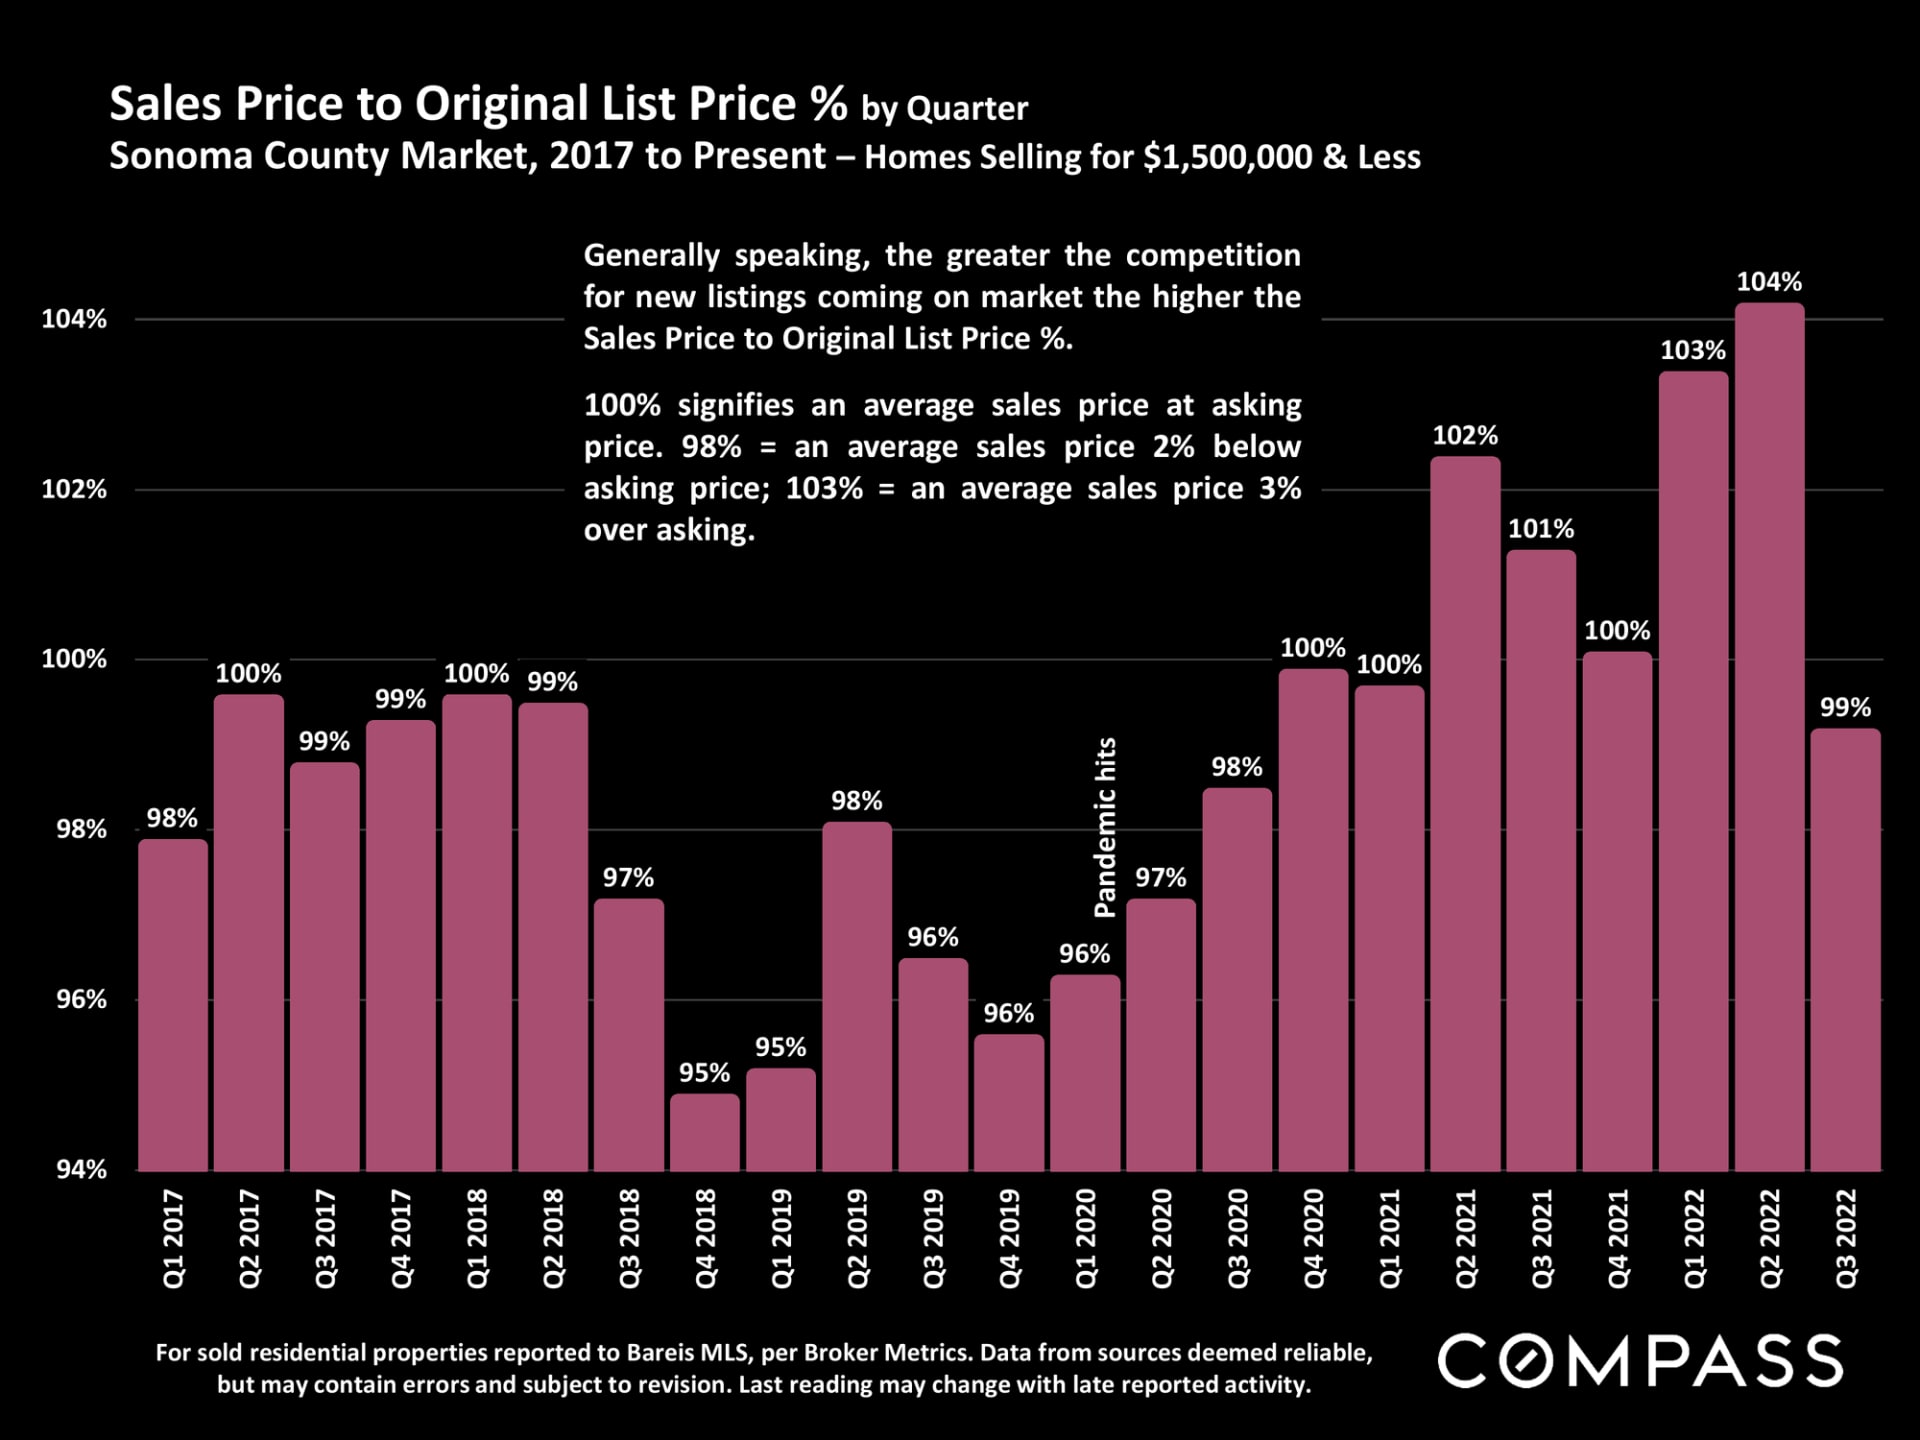
Chart of Sonoma County sale-to-list price ratios, peaking at 104% in Q2 2022.
 
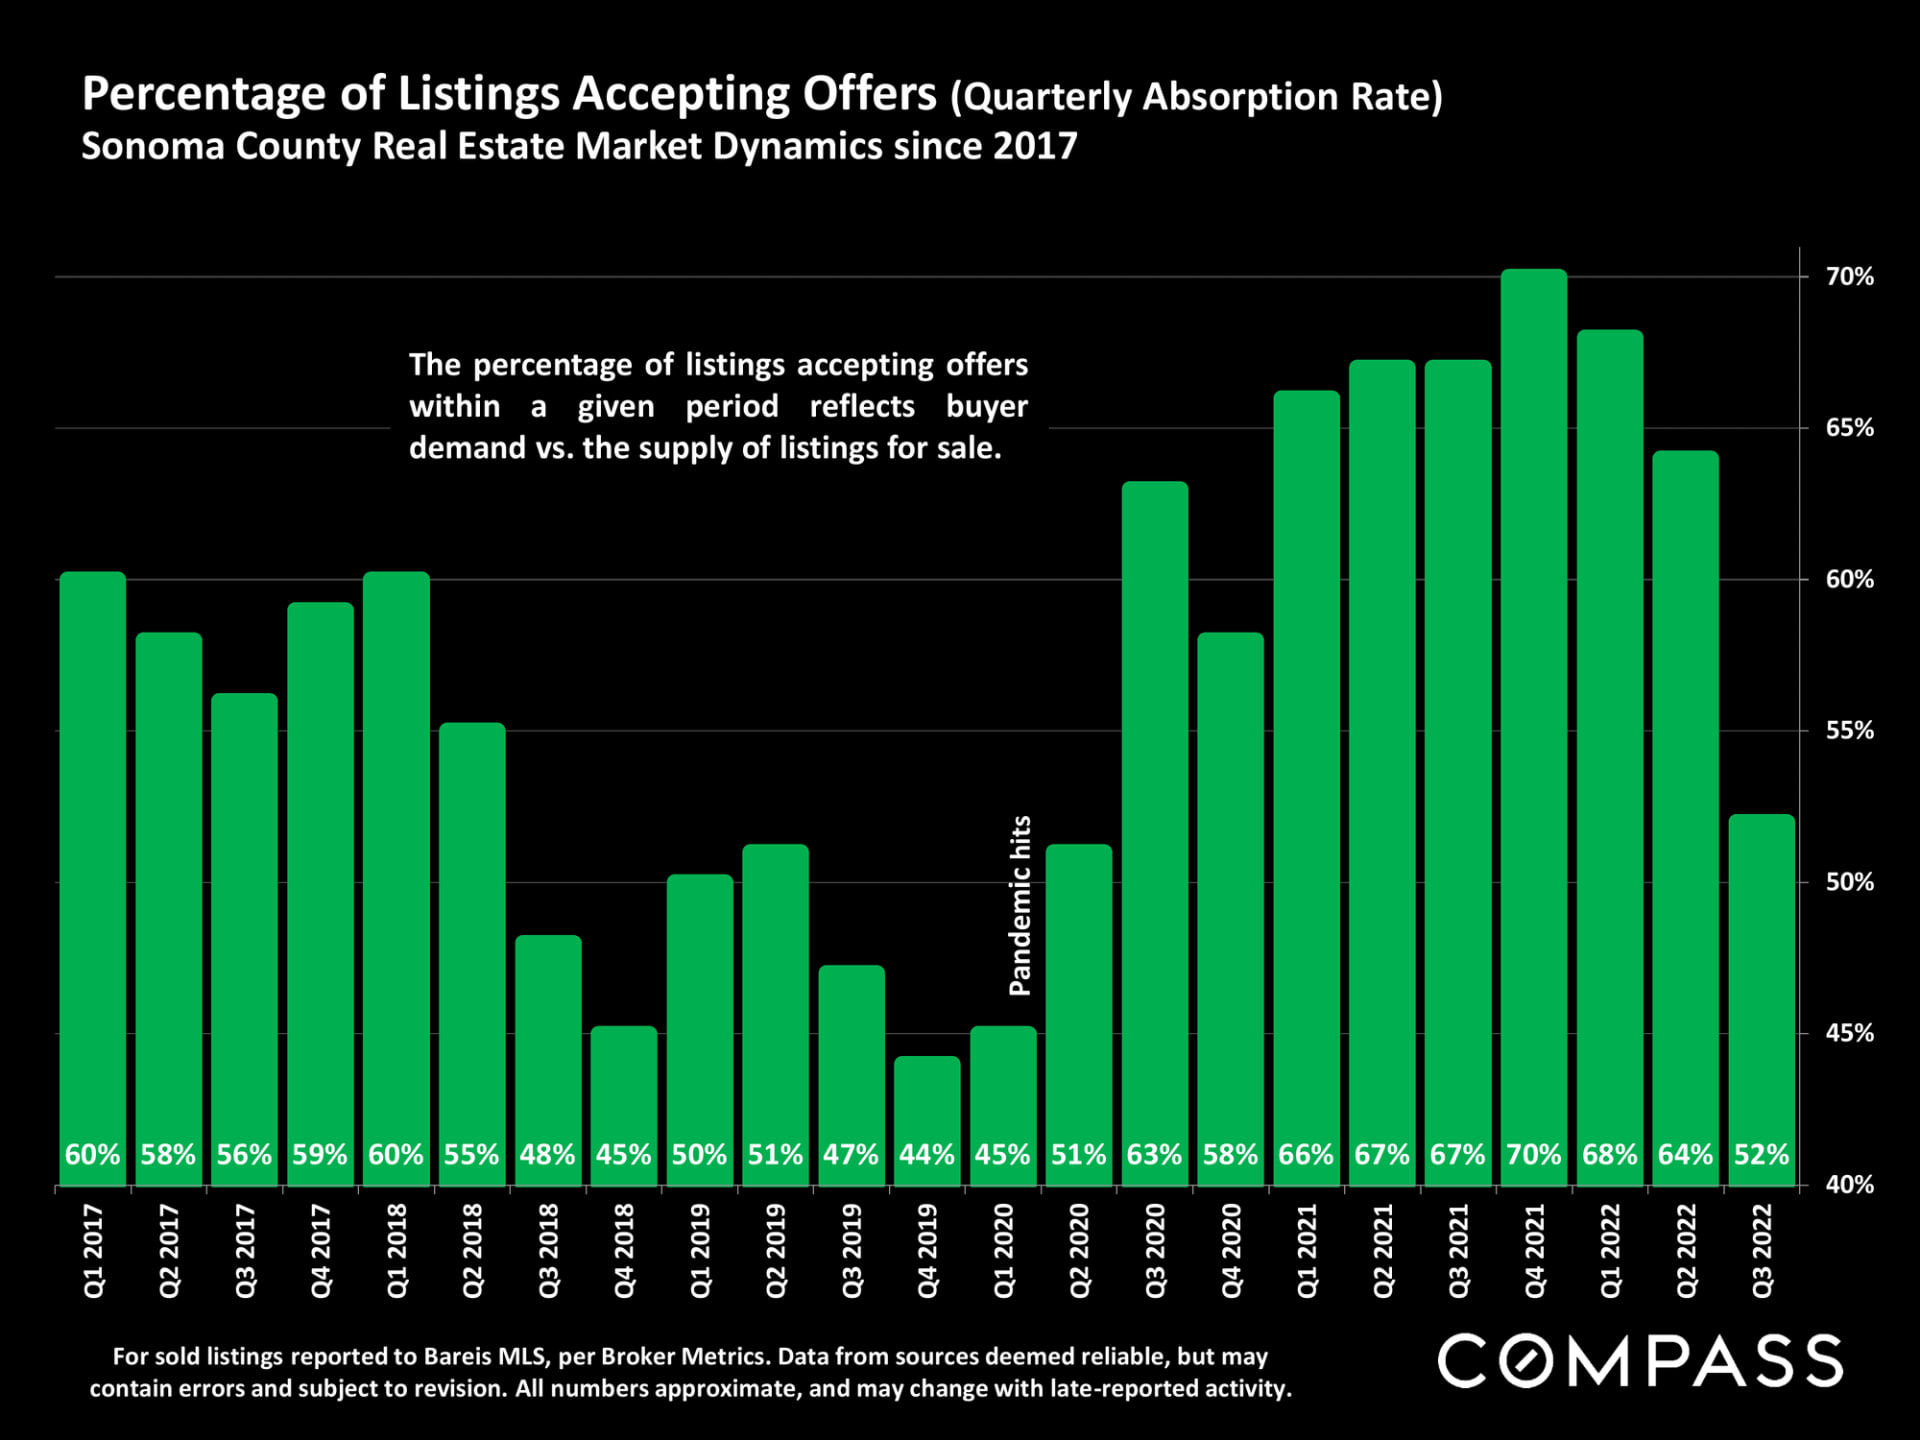
Chart of Sonoma County listings accepting offers by quarter, with a 70% peak in Q4 2021 and a pandemic marker.
 
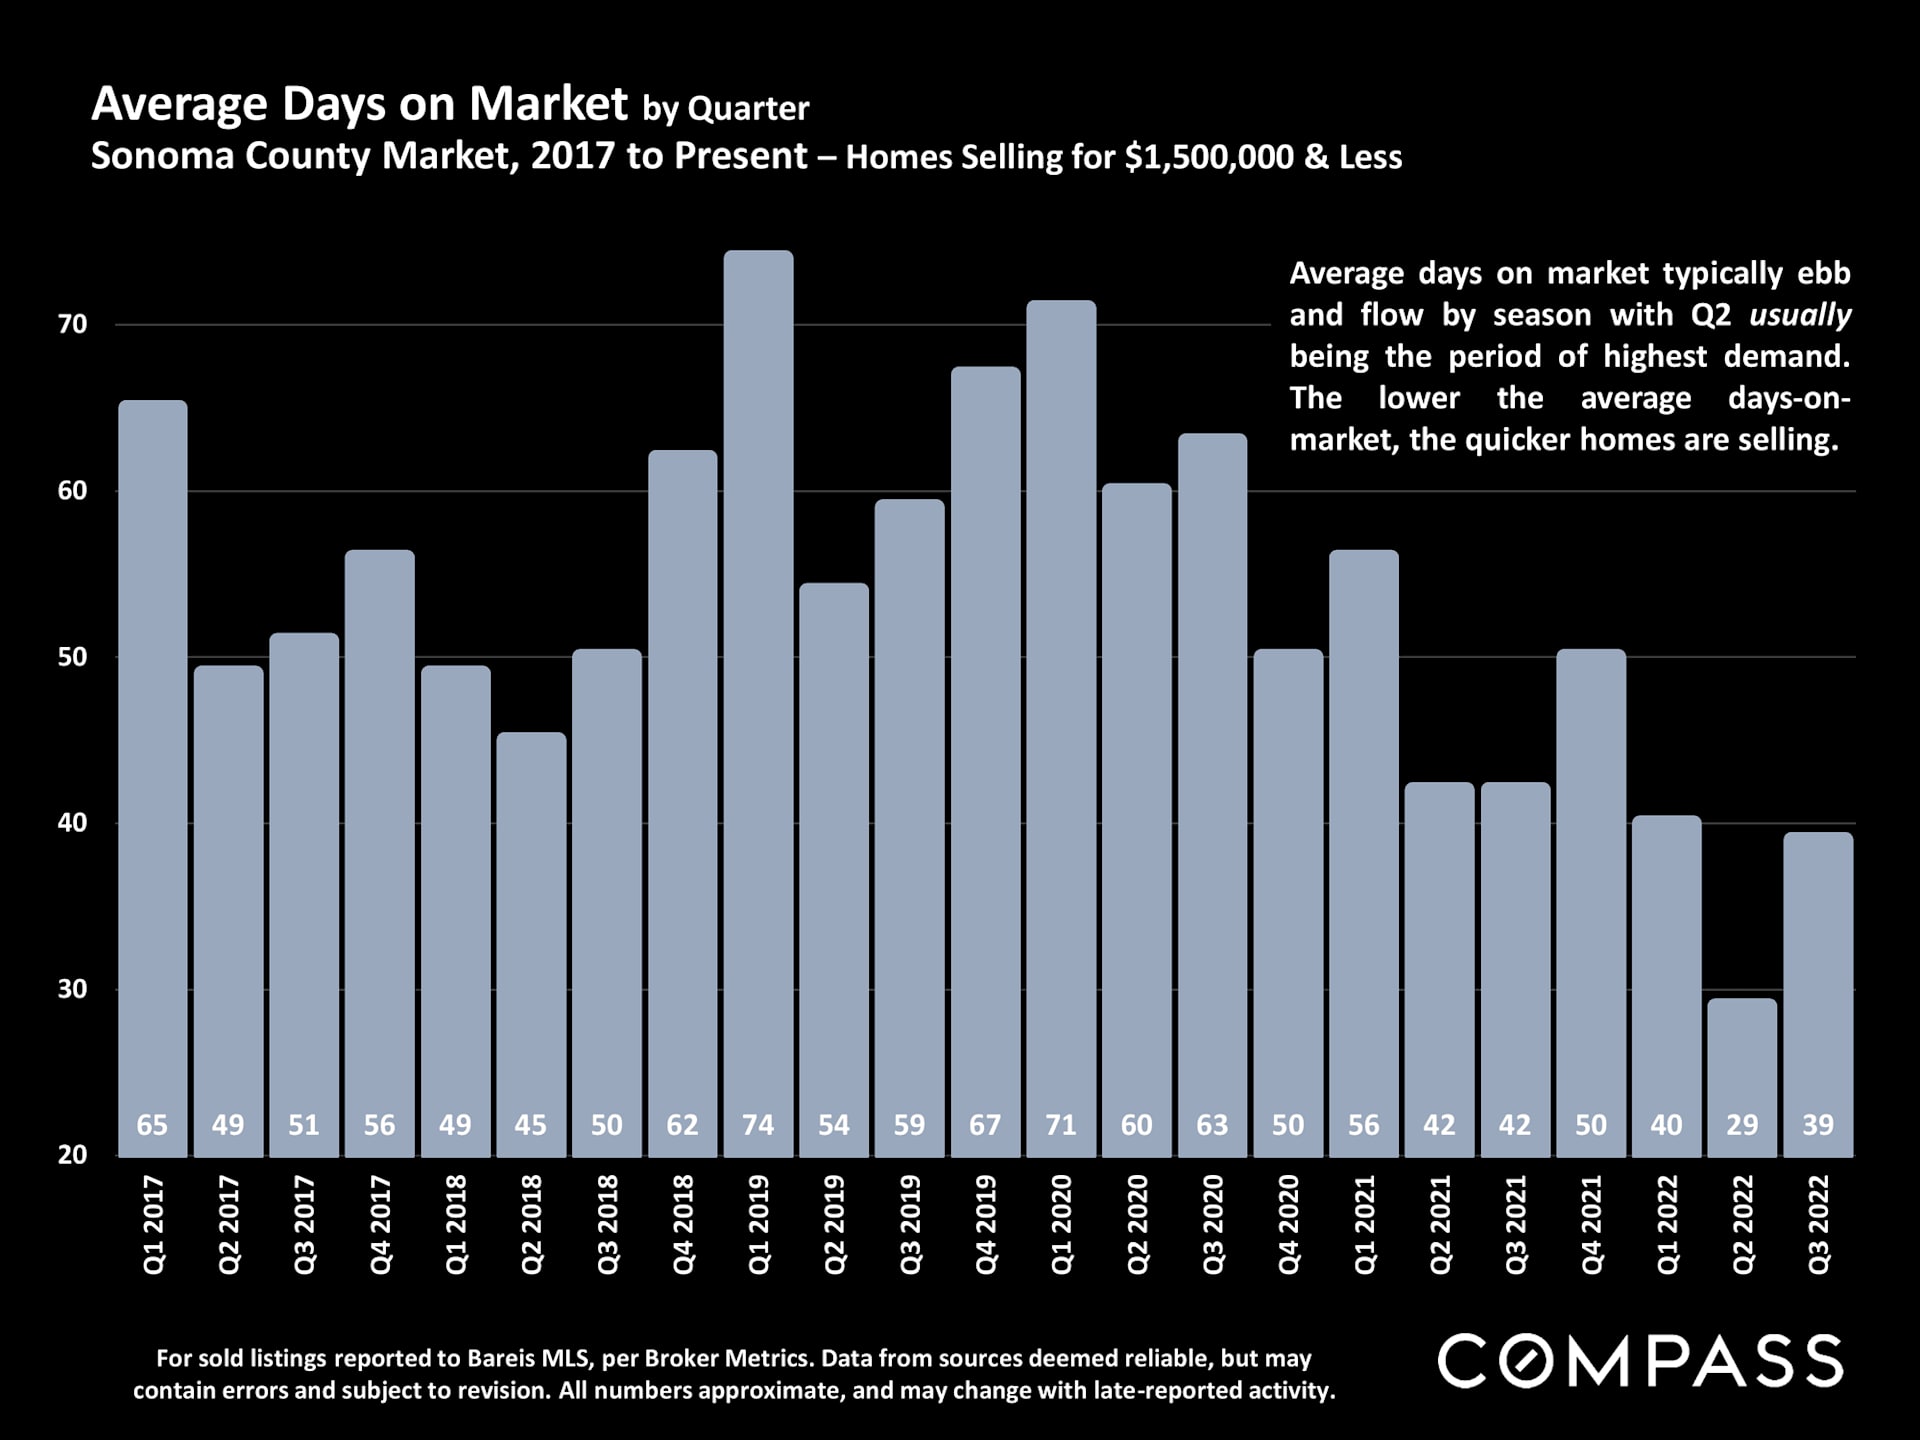
Bar chart of Sonoma County home-selling times by quarter, with the average falling to 29 days in Q2 2022.
 
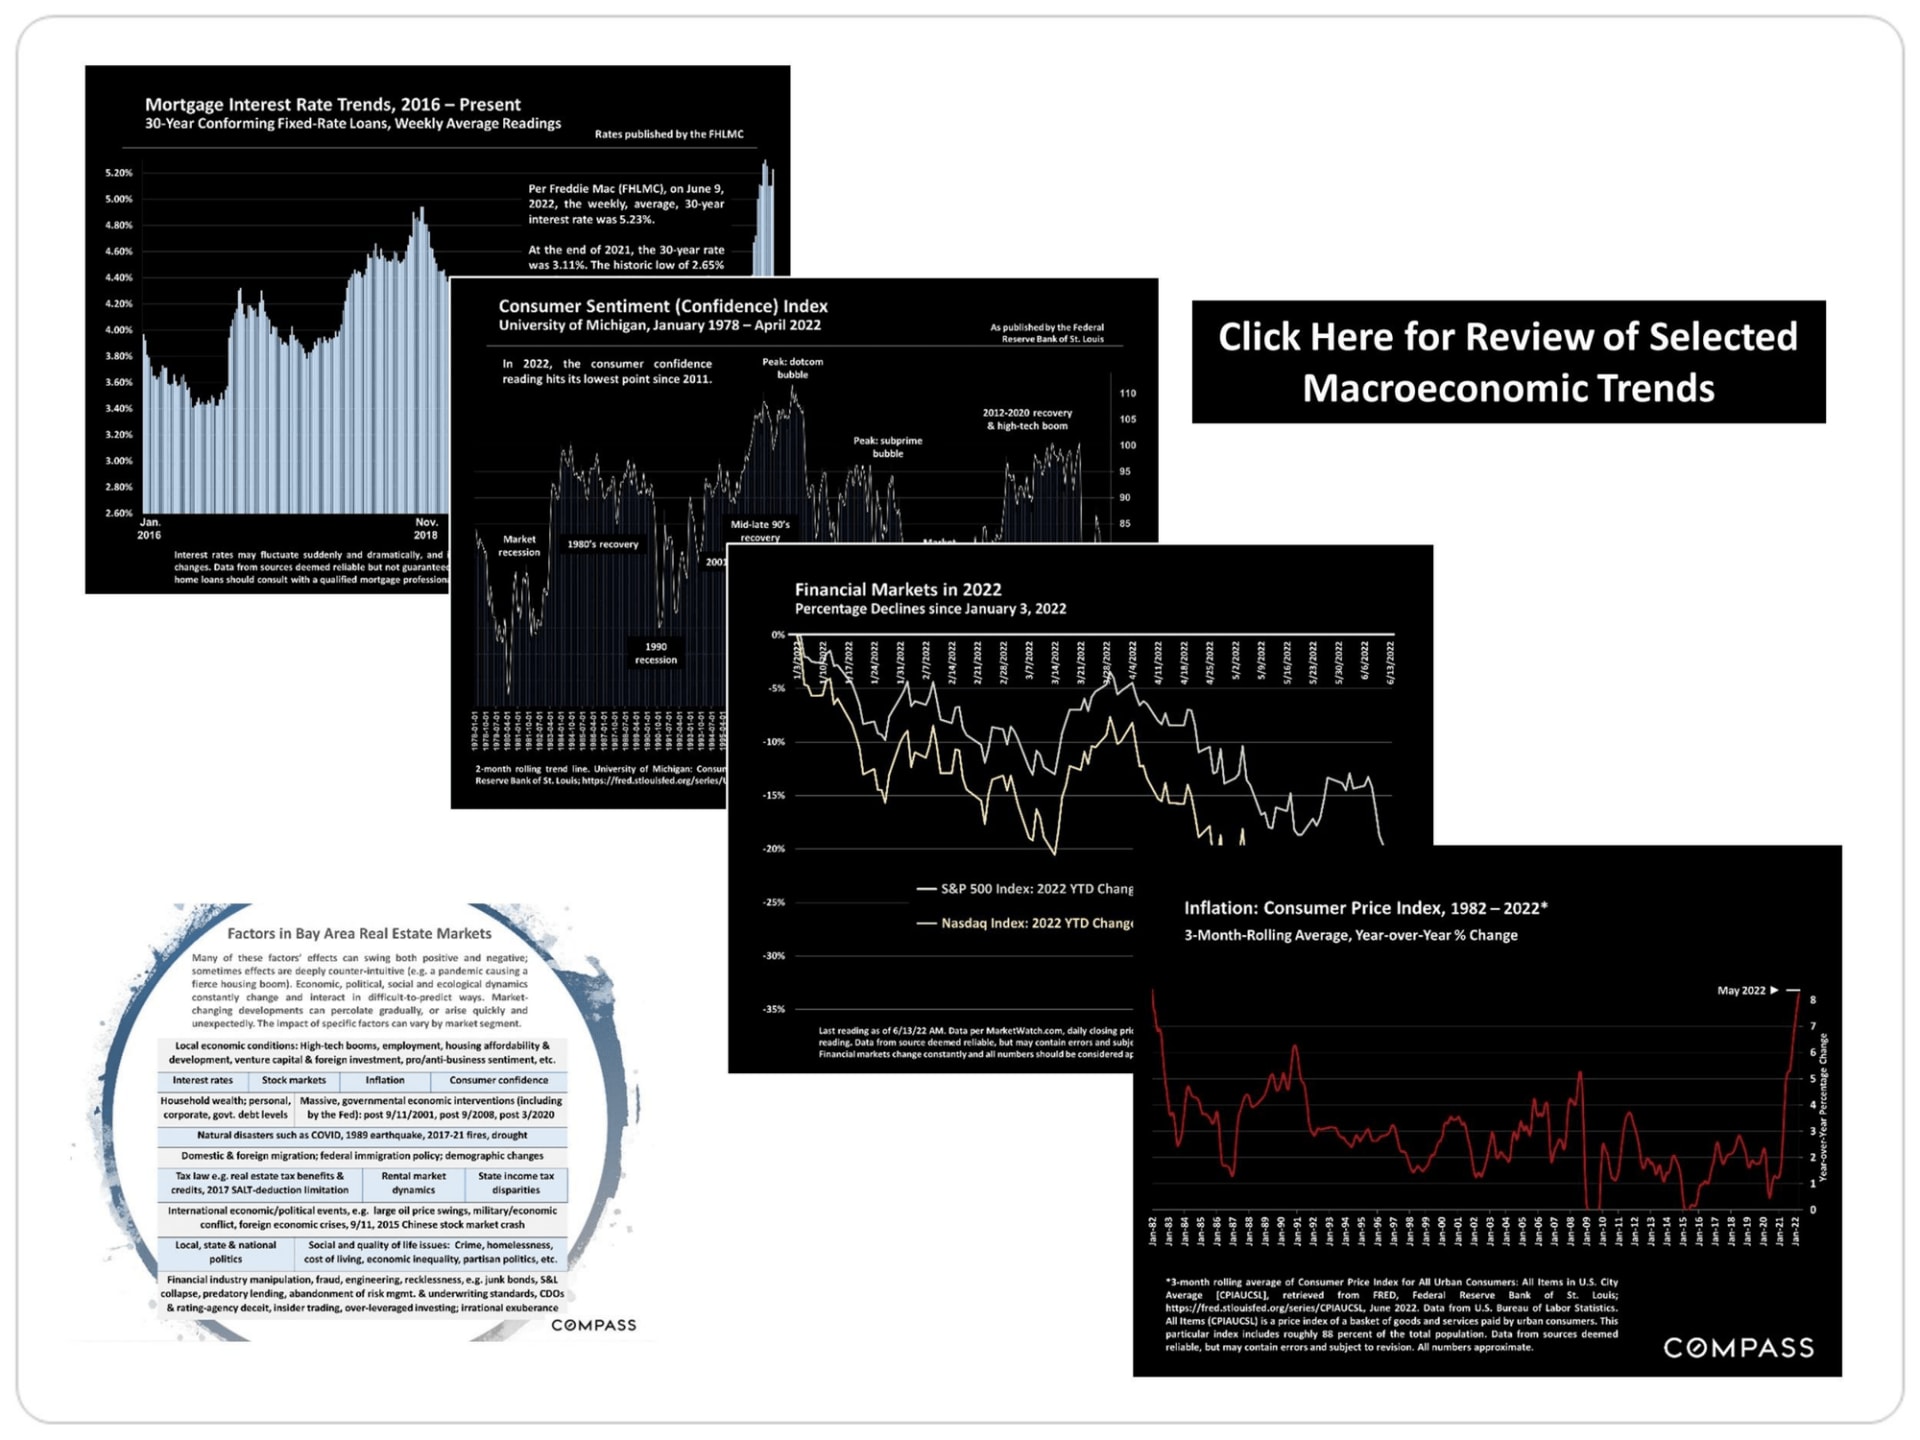
Macroeconomic charts and a Bay Area real estate market factors infographic, with a banner linking to a trends review.
 
 
San Francisco Bay Area real estate survey promotion with a Golden Gate Bridge photo and full-report link.
 
 
San Francisco Bay Area home price appreciation report cover with regional landscape collage and Compass wordmark.
 
 
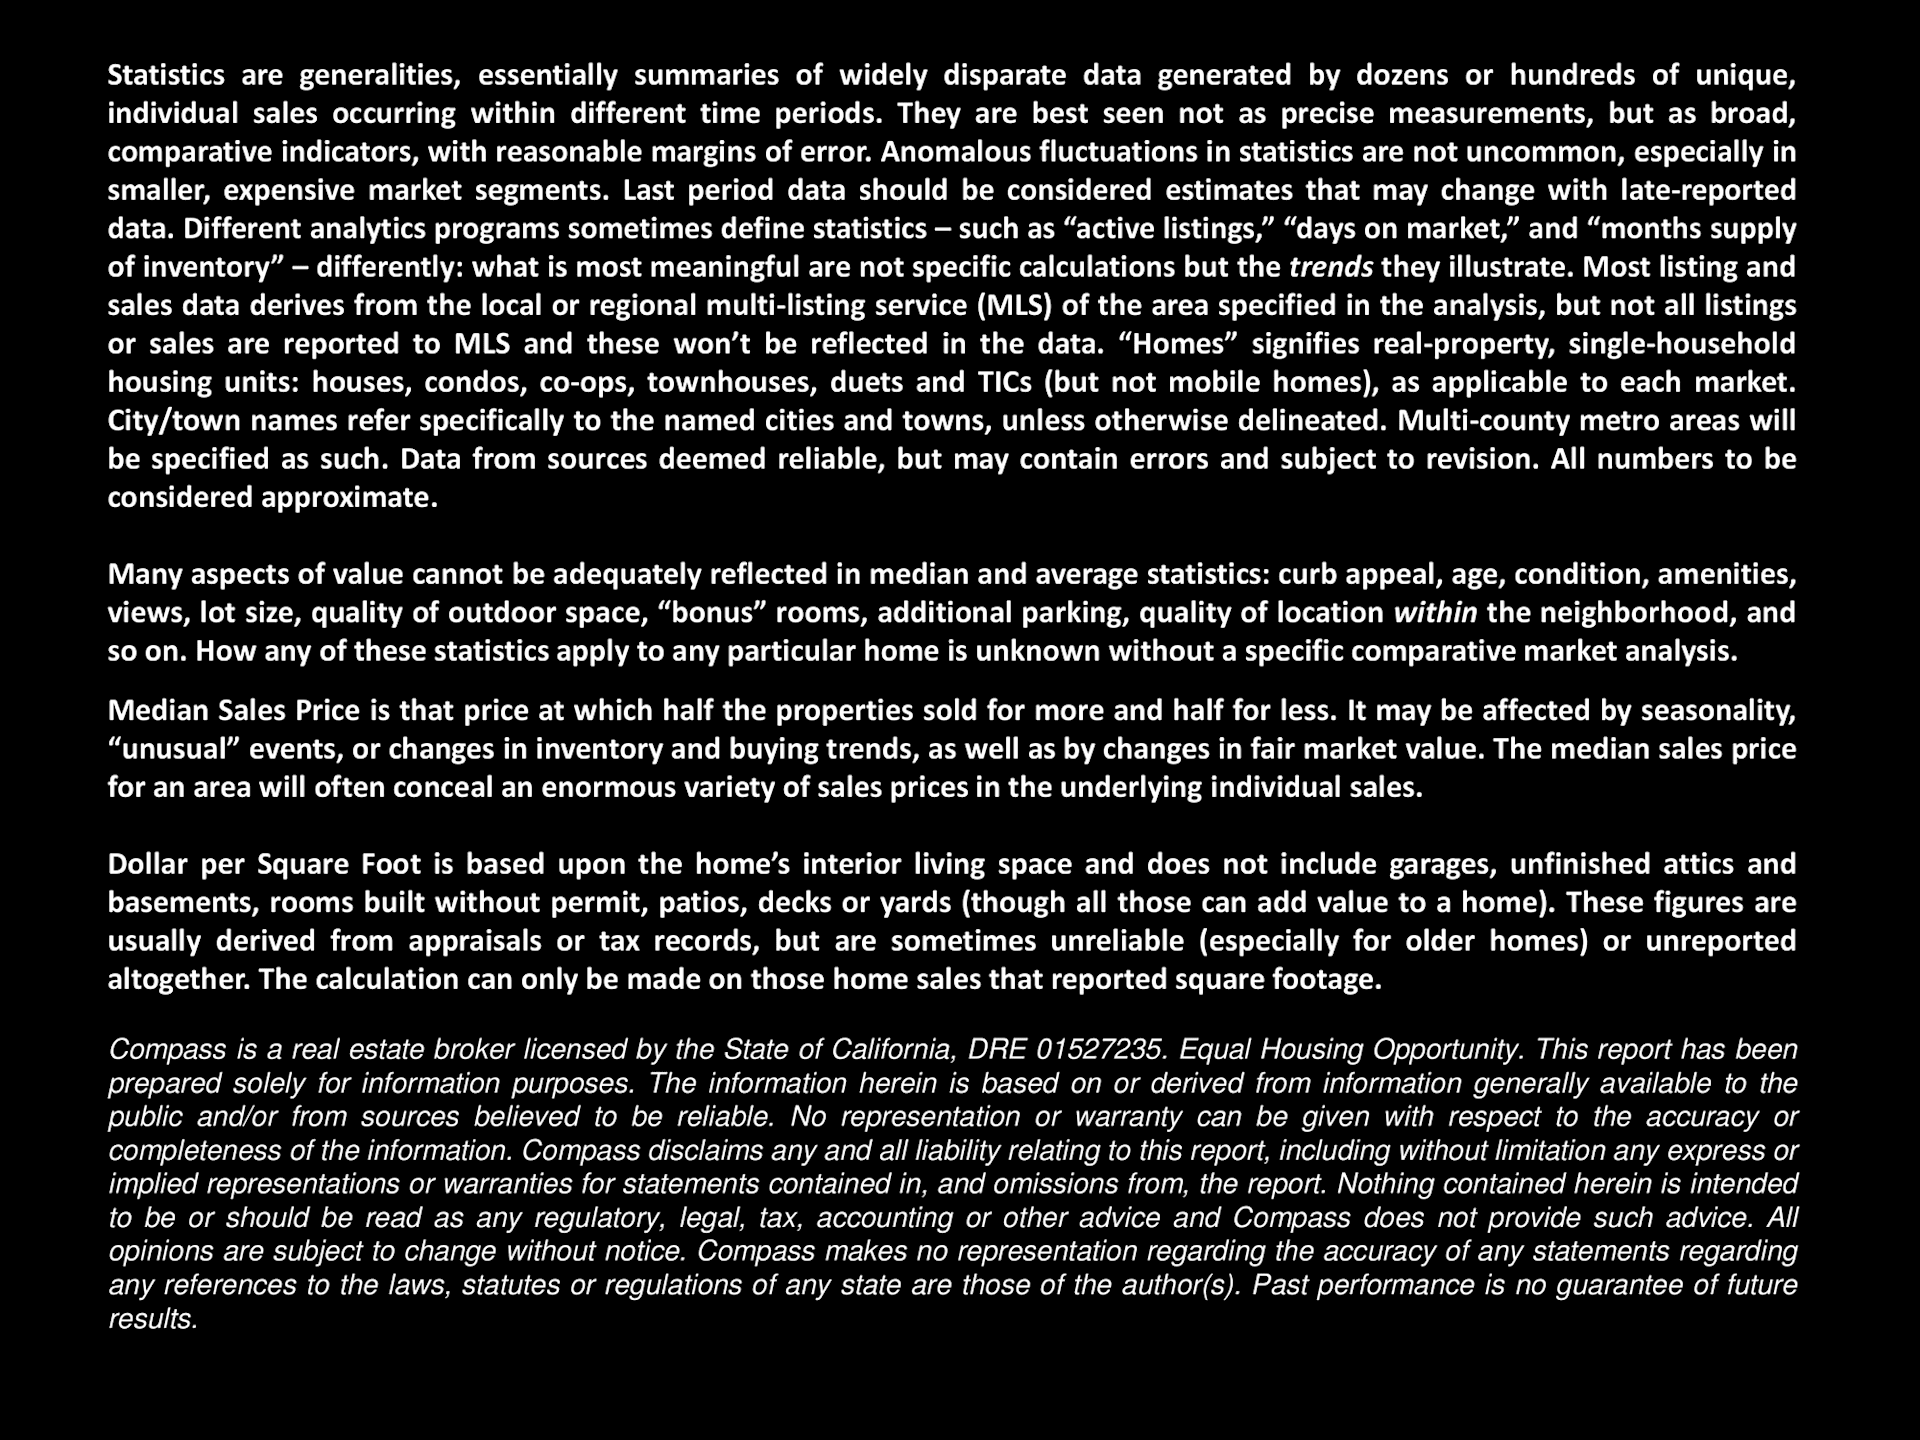
Real estate report definitions and disclaimer covering housing statistics, median sale price, and dollar per square foot.

View More Homes for Sale in Sonoma, Healdsburg, Sebastopol and More

Home Search

Work With Me

My commitment to ethical representation and depth of experience are the foundation of my success.
Contact Me

Follow Us on Instagram