Blog

Sonoma County Real Estate November 2022 Report

Sonoma County Real Estate November 2022 Report

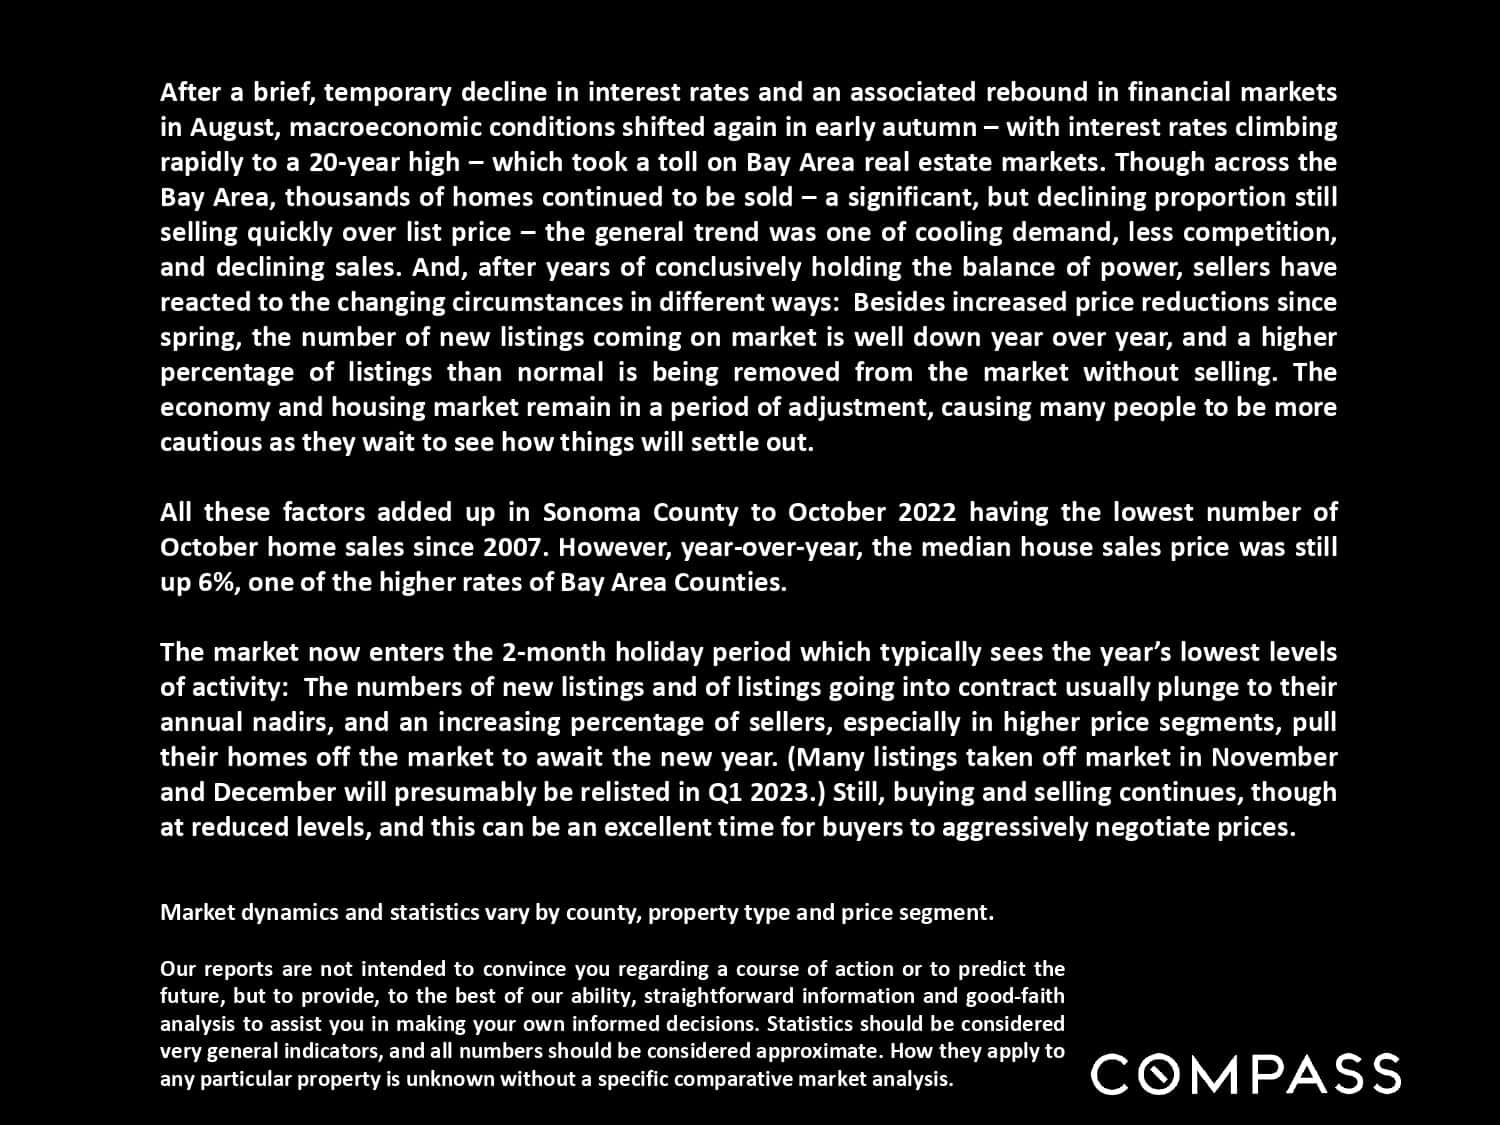
Sonoma County real estate market report on sales, prices, interest rates, and seasonal activity.

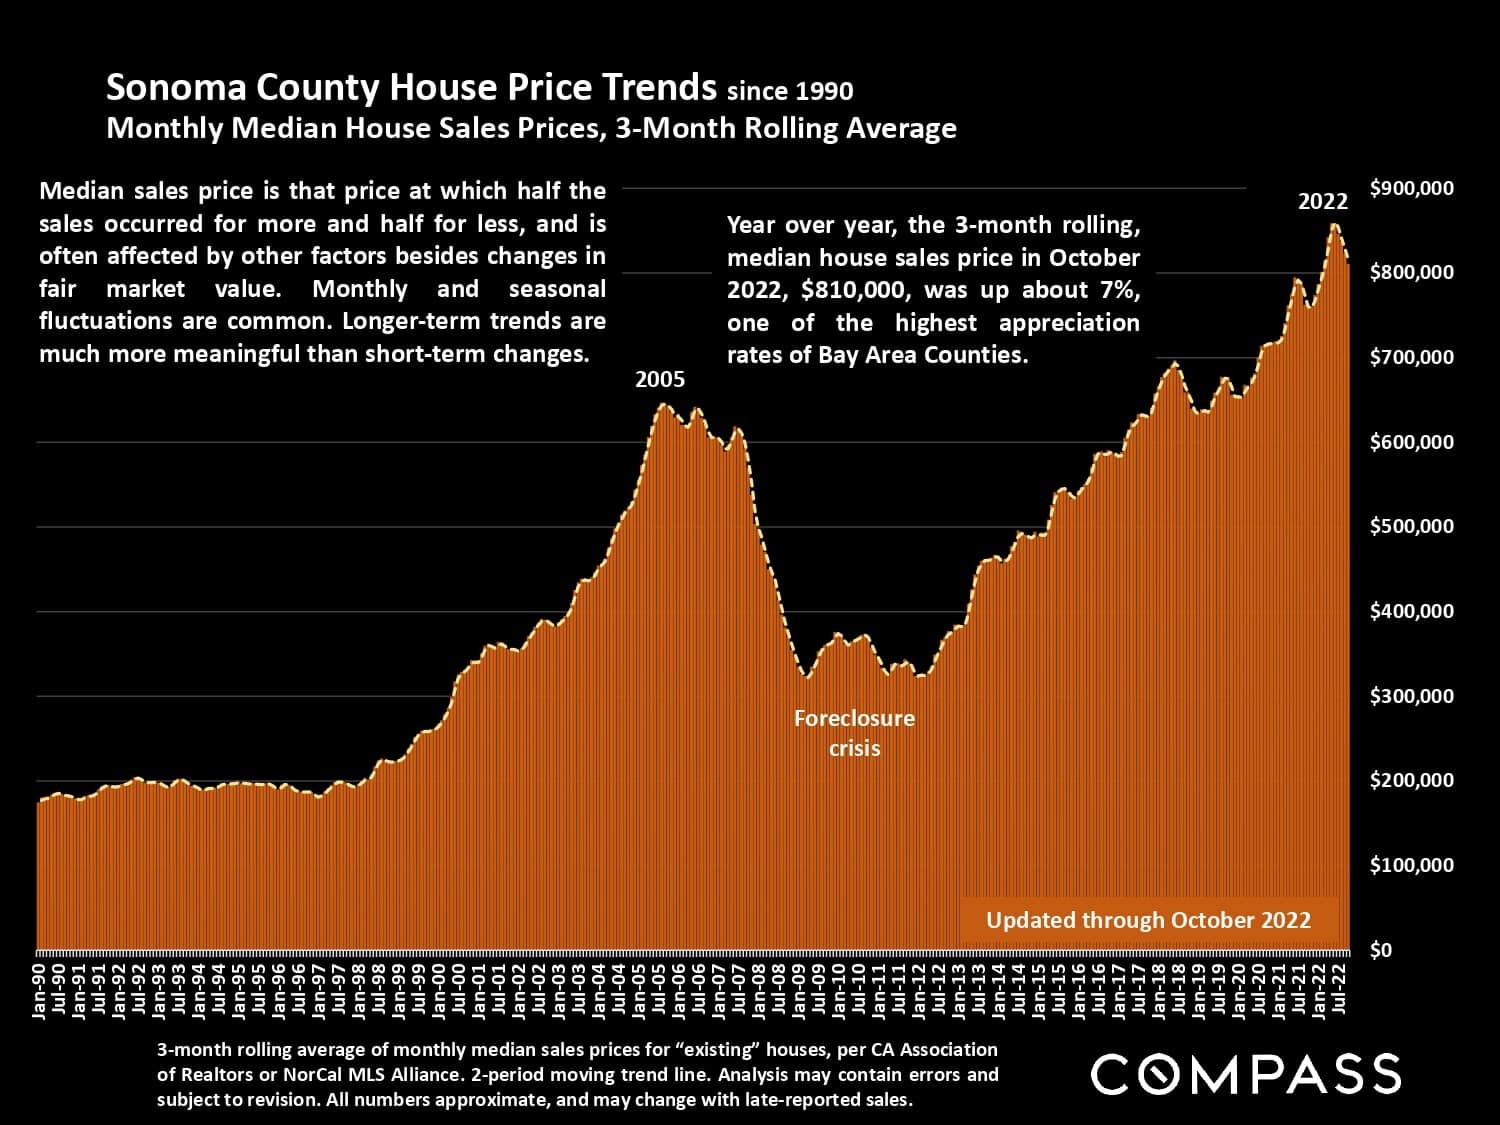
Sonoma County home price chart, showing the long-term rise and the foreclosure-crisis decline through 2022.

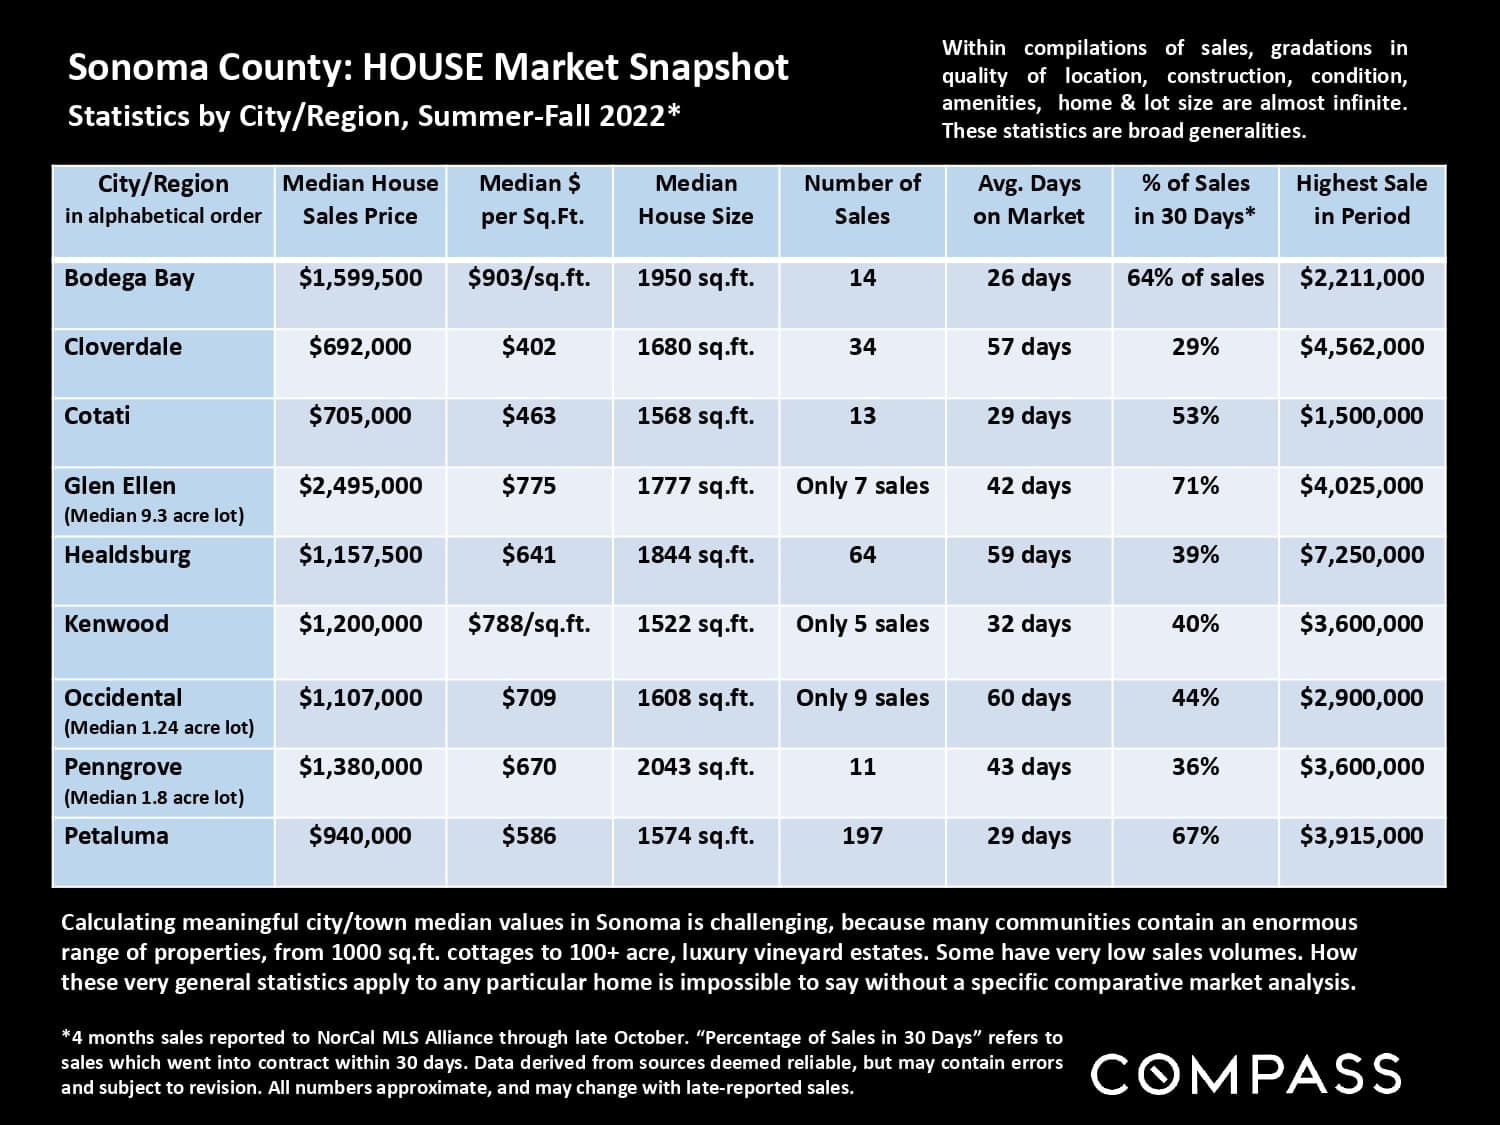
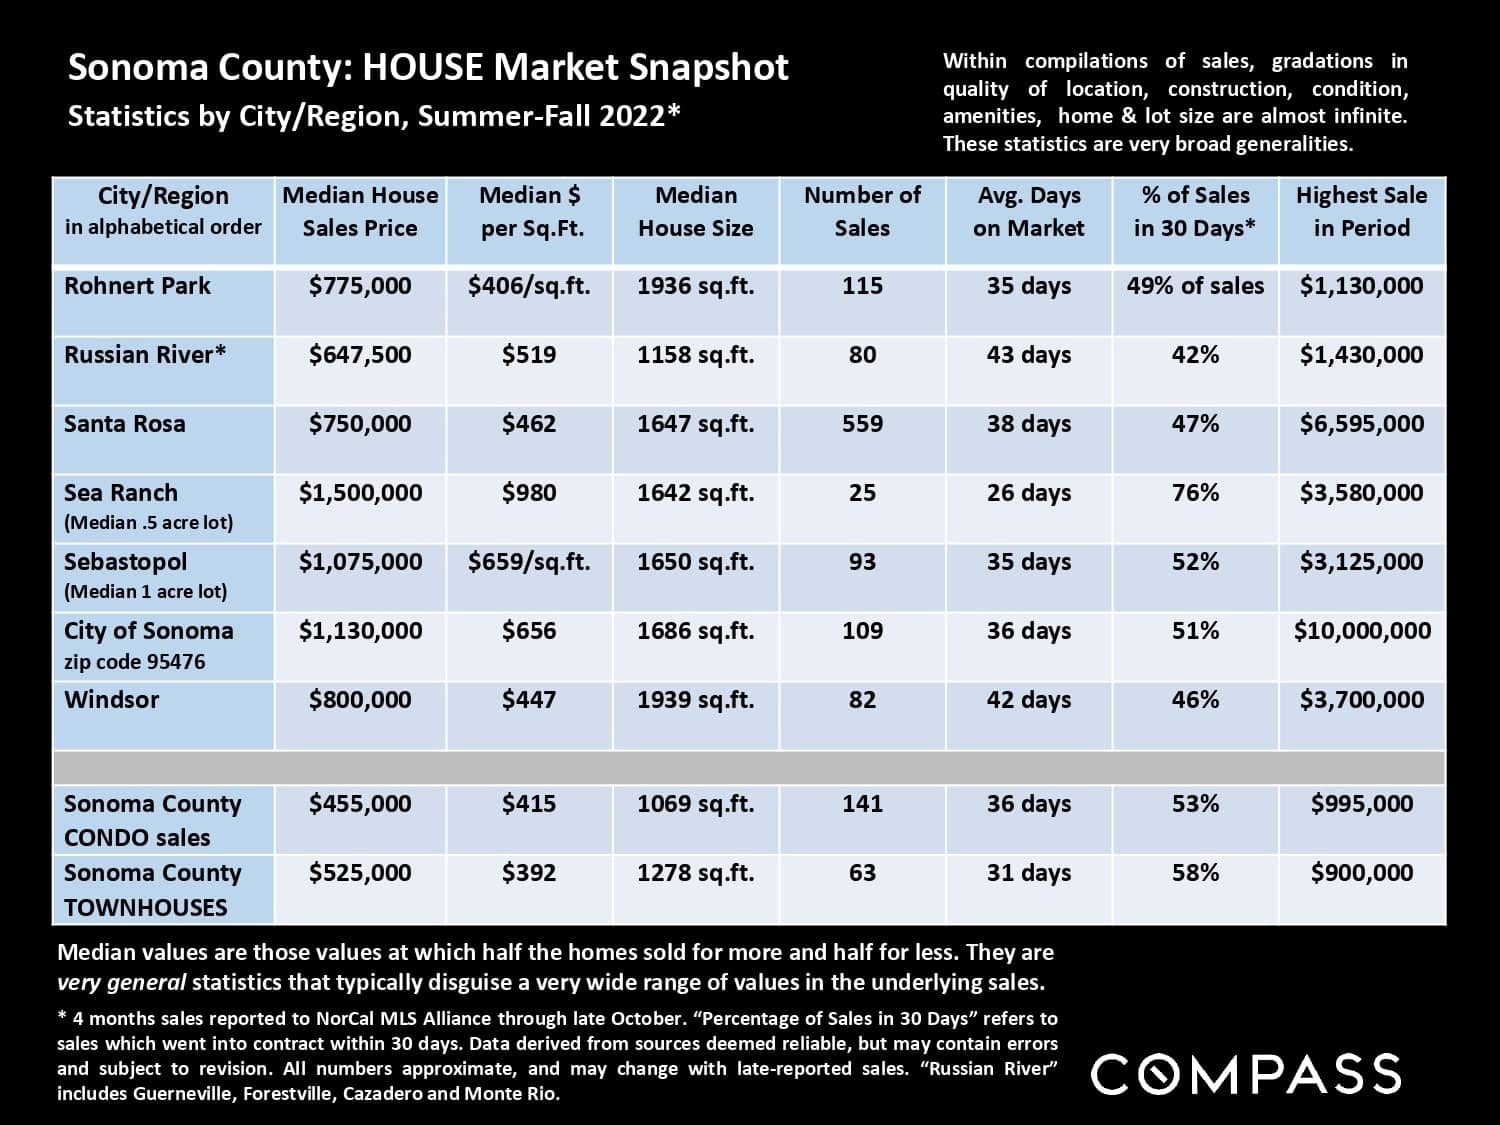
Sonoma County Summer-Fall 2022 housing market statistics by city and region.

Sonoma County Summer-Fall 2022 housing market statistics by city and region.

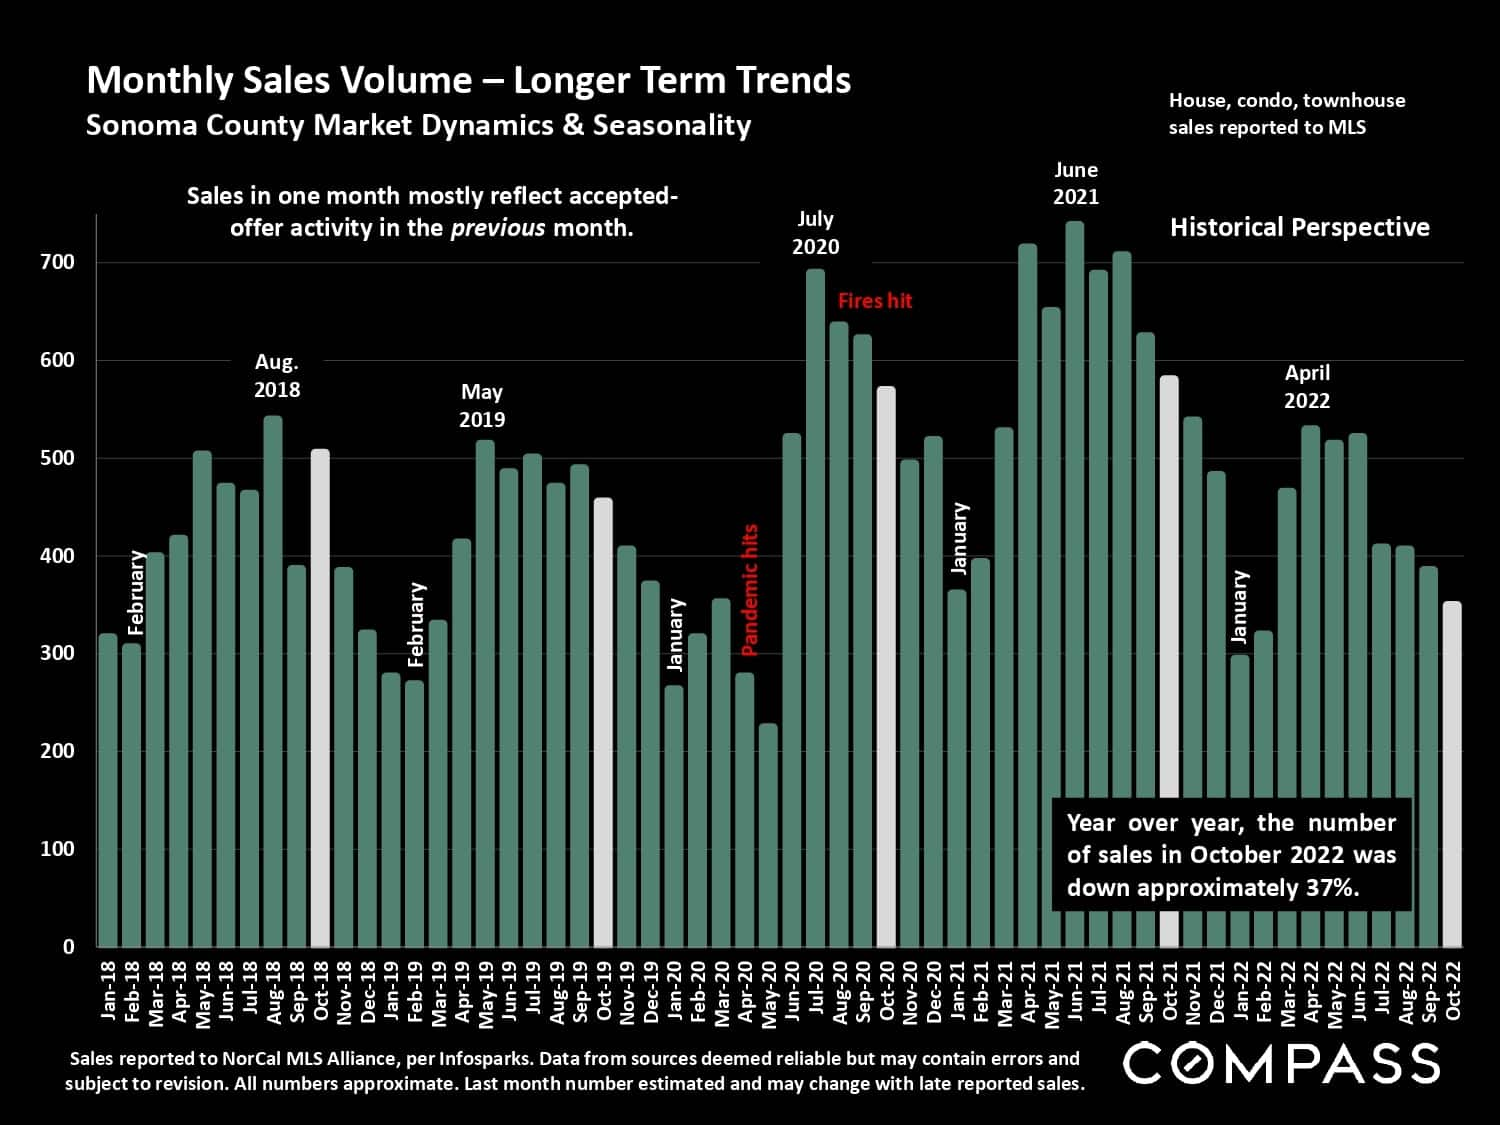
Bar chart of Sonoma County monthly home sales from 2018 to 2022, showing October 2022 down about 37% year over year.

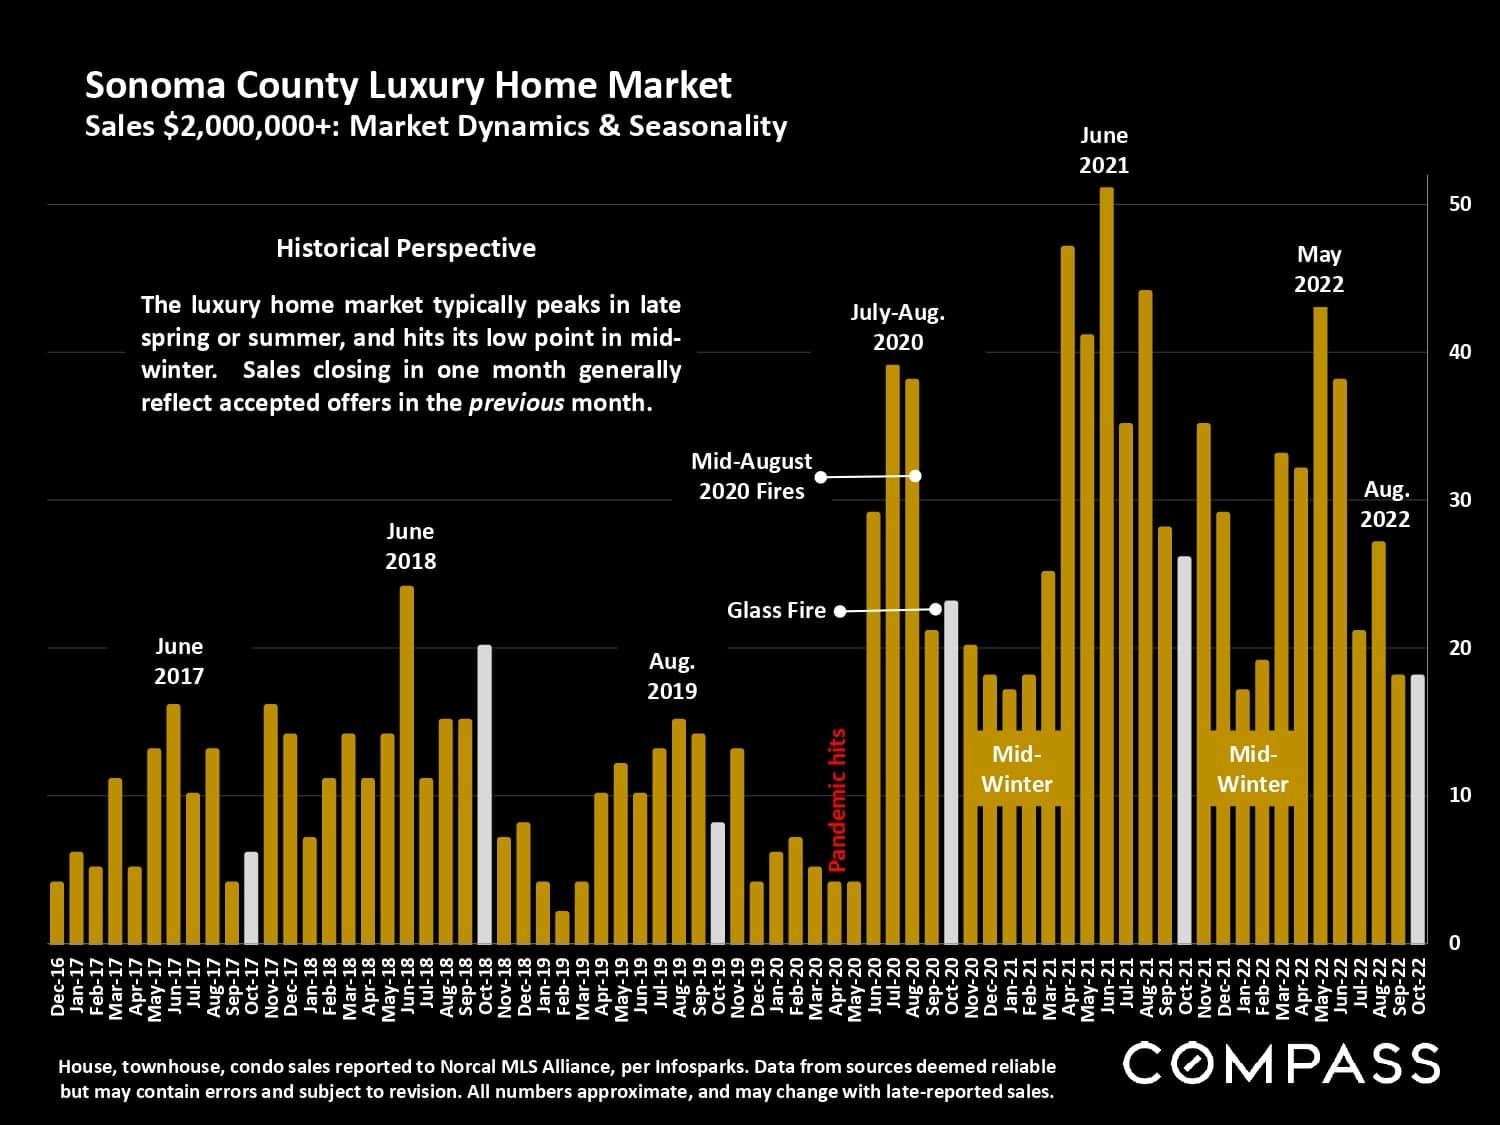
Chart of Sonoma County luxury home sales from December 2016 to October 2022, with seasonal trends and market events.

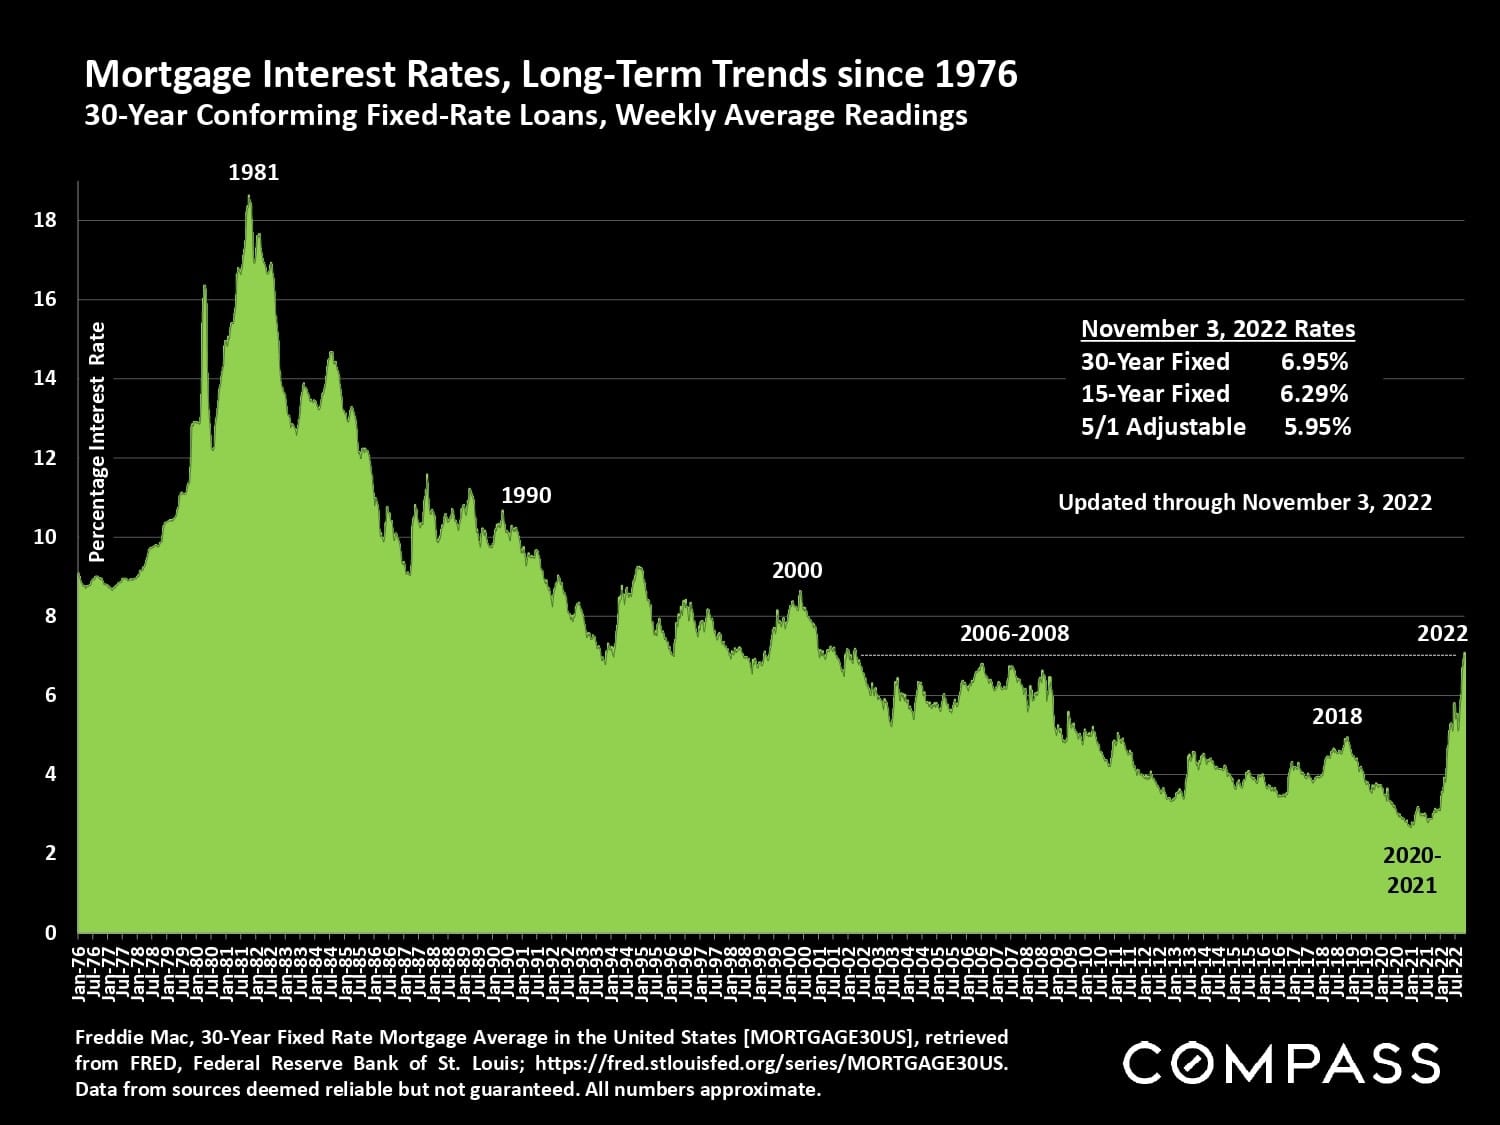
Chart of mortgage rates since 1976, showing a sharp rise to 6.95% for 30-year fixed loans in November 2022.

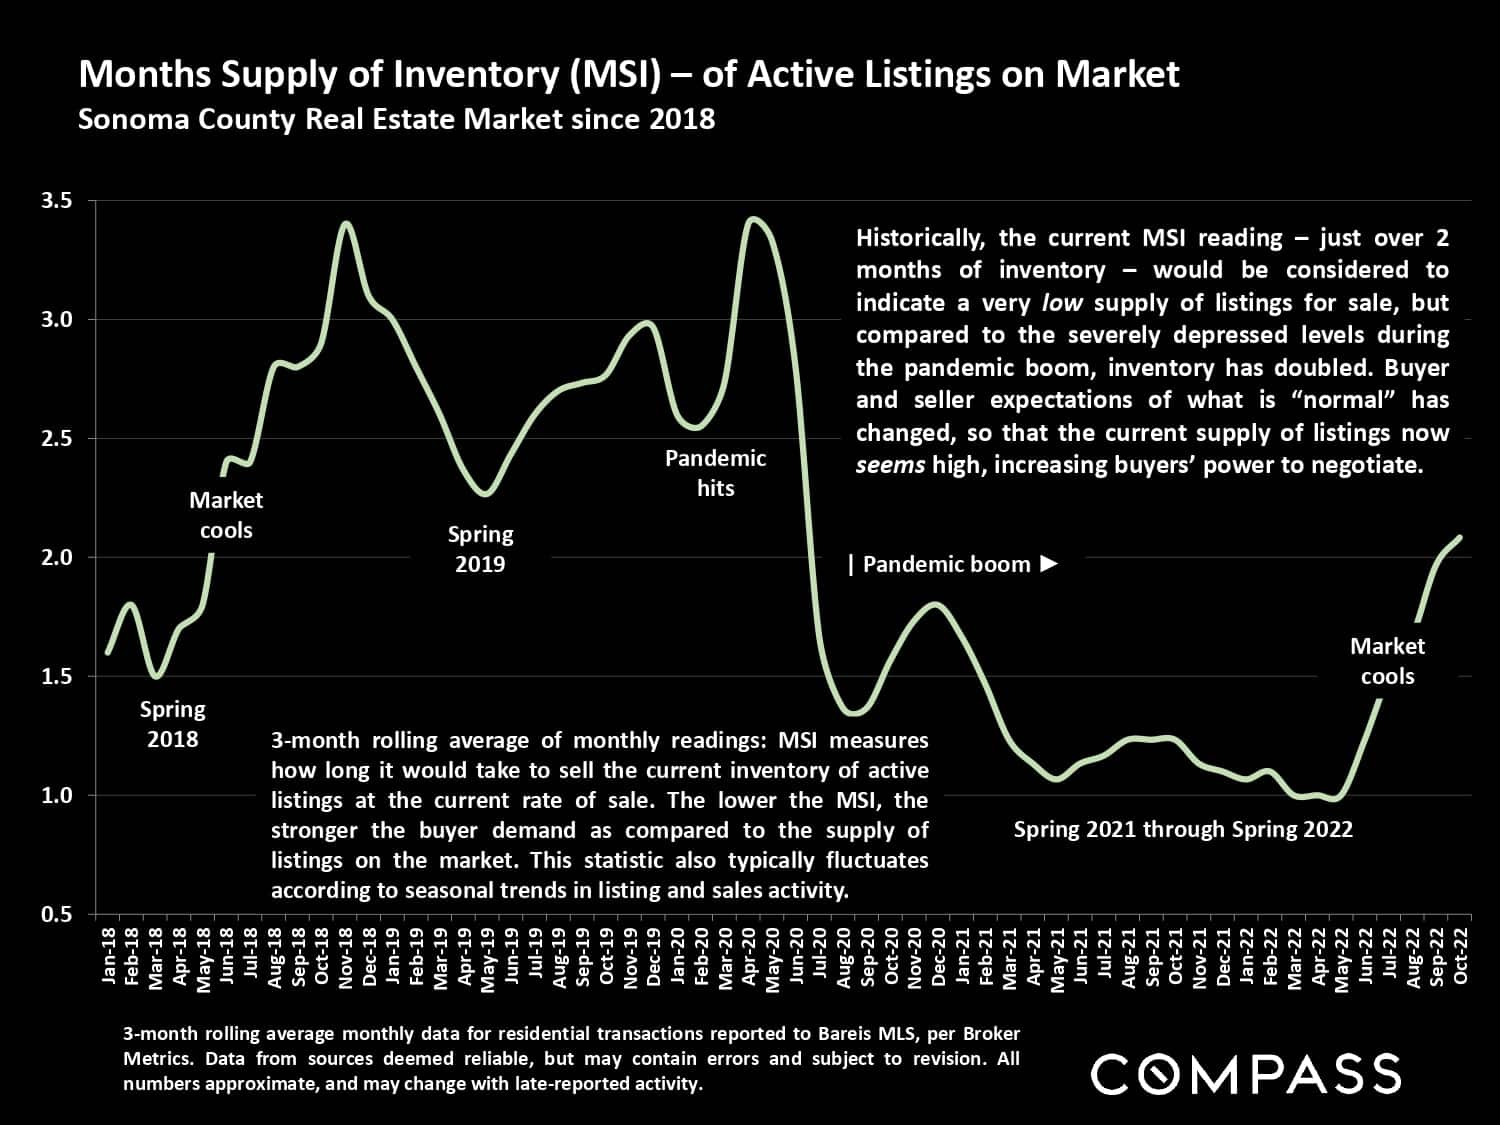
Sonoma County active-listing inventory chart, showing months of supply from 2018 to October 2022.

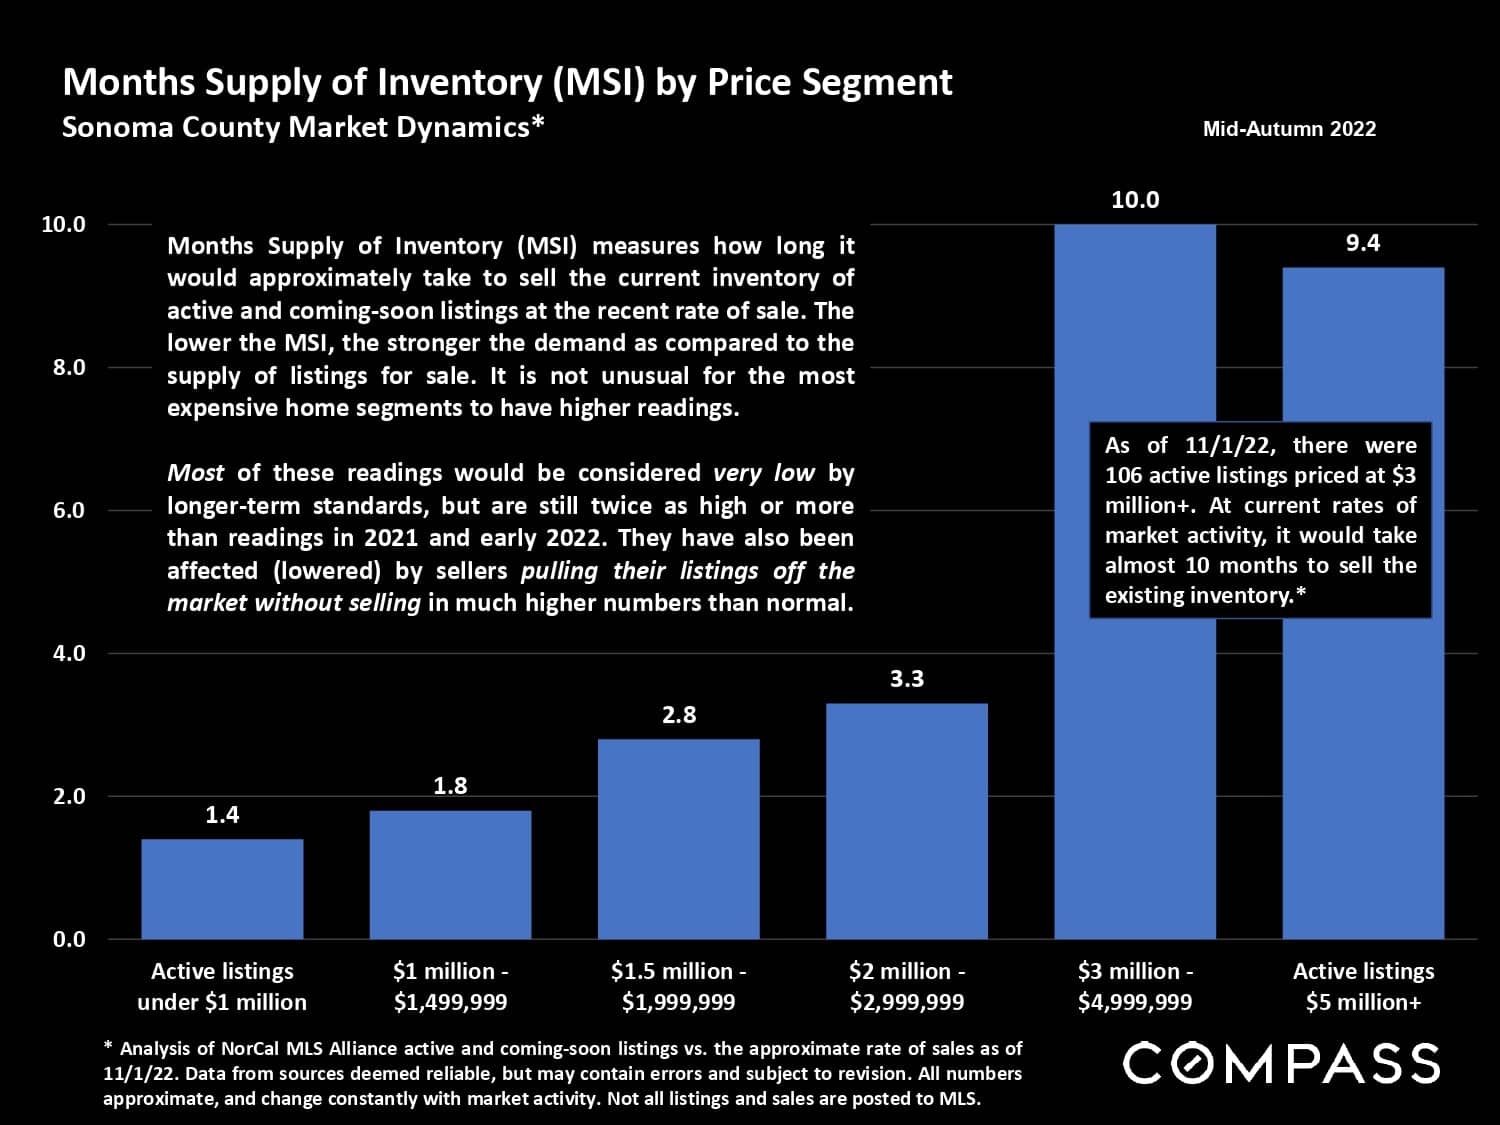
Sonoma County inventory-supply chart by price segment, with the highest reading—10 months—in the $3–4.999 million range.

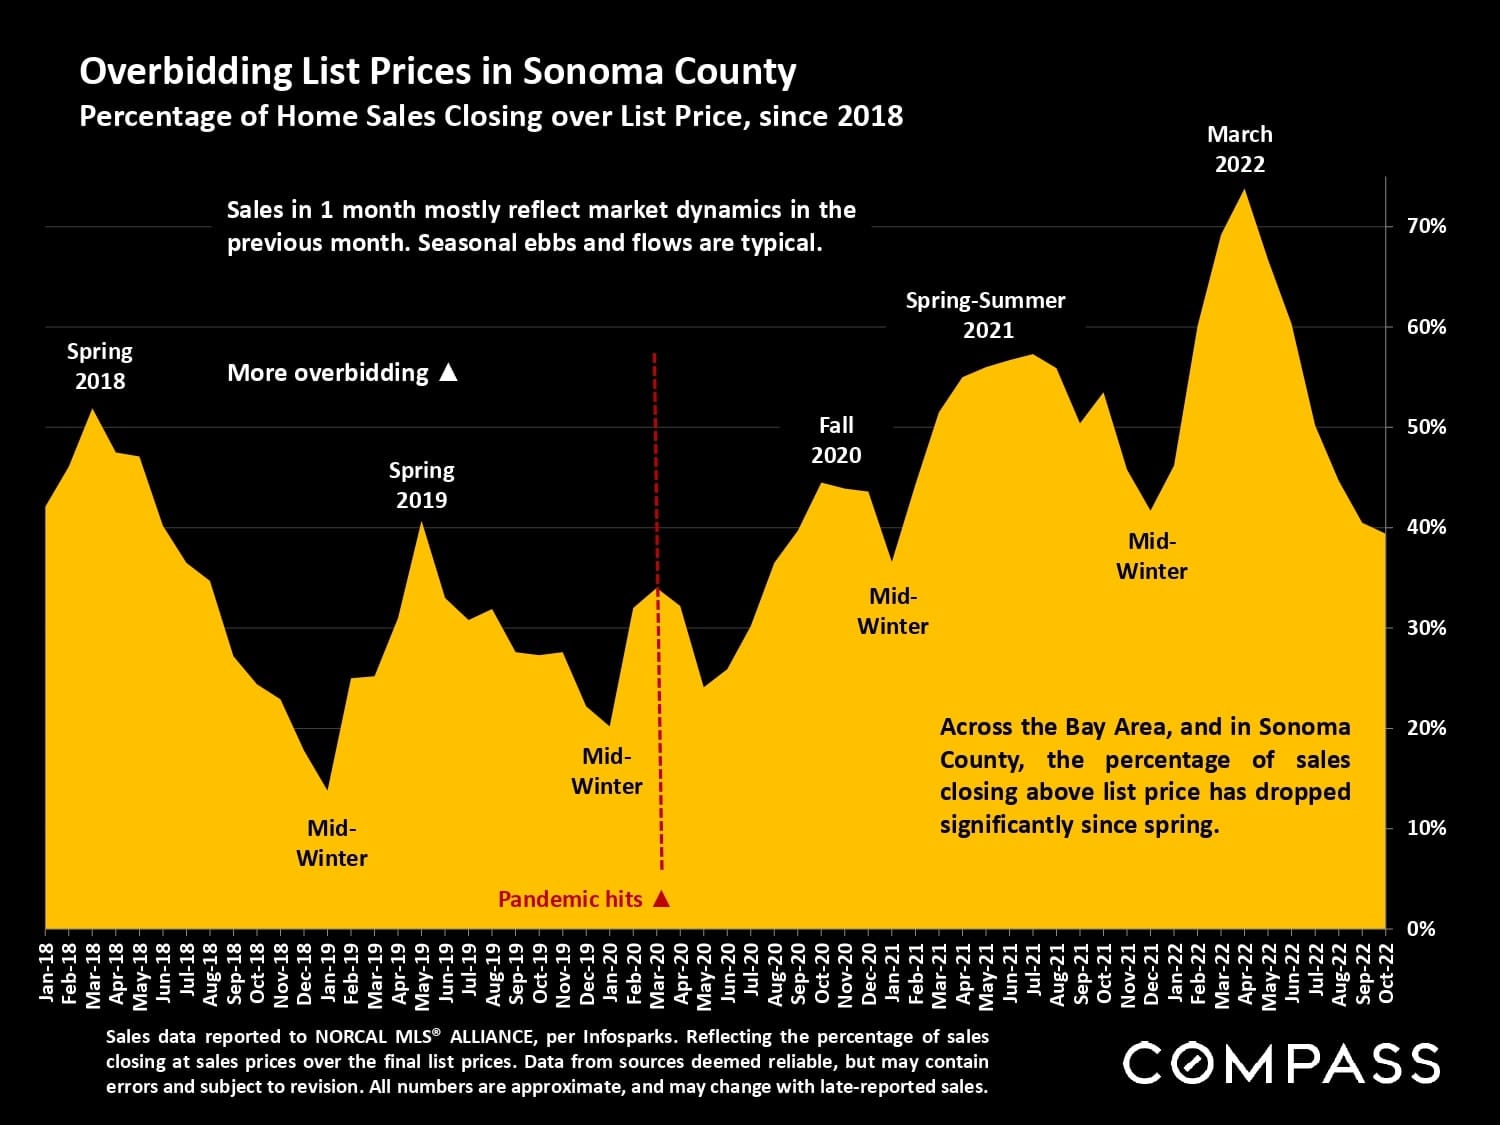
Chart of Sonoma County home sales closing above list price from 2018 to 2022.

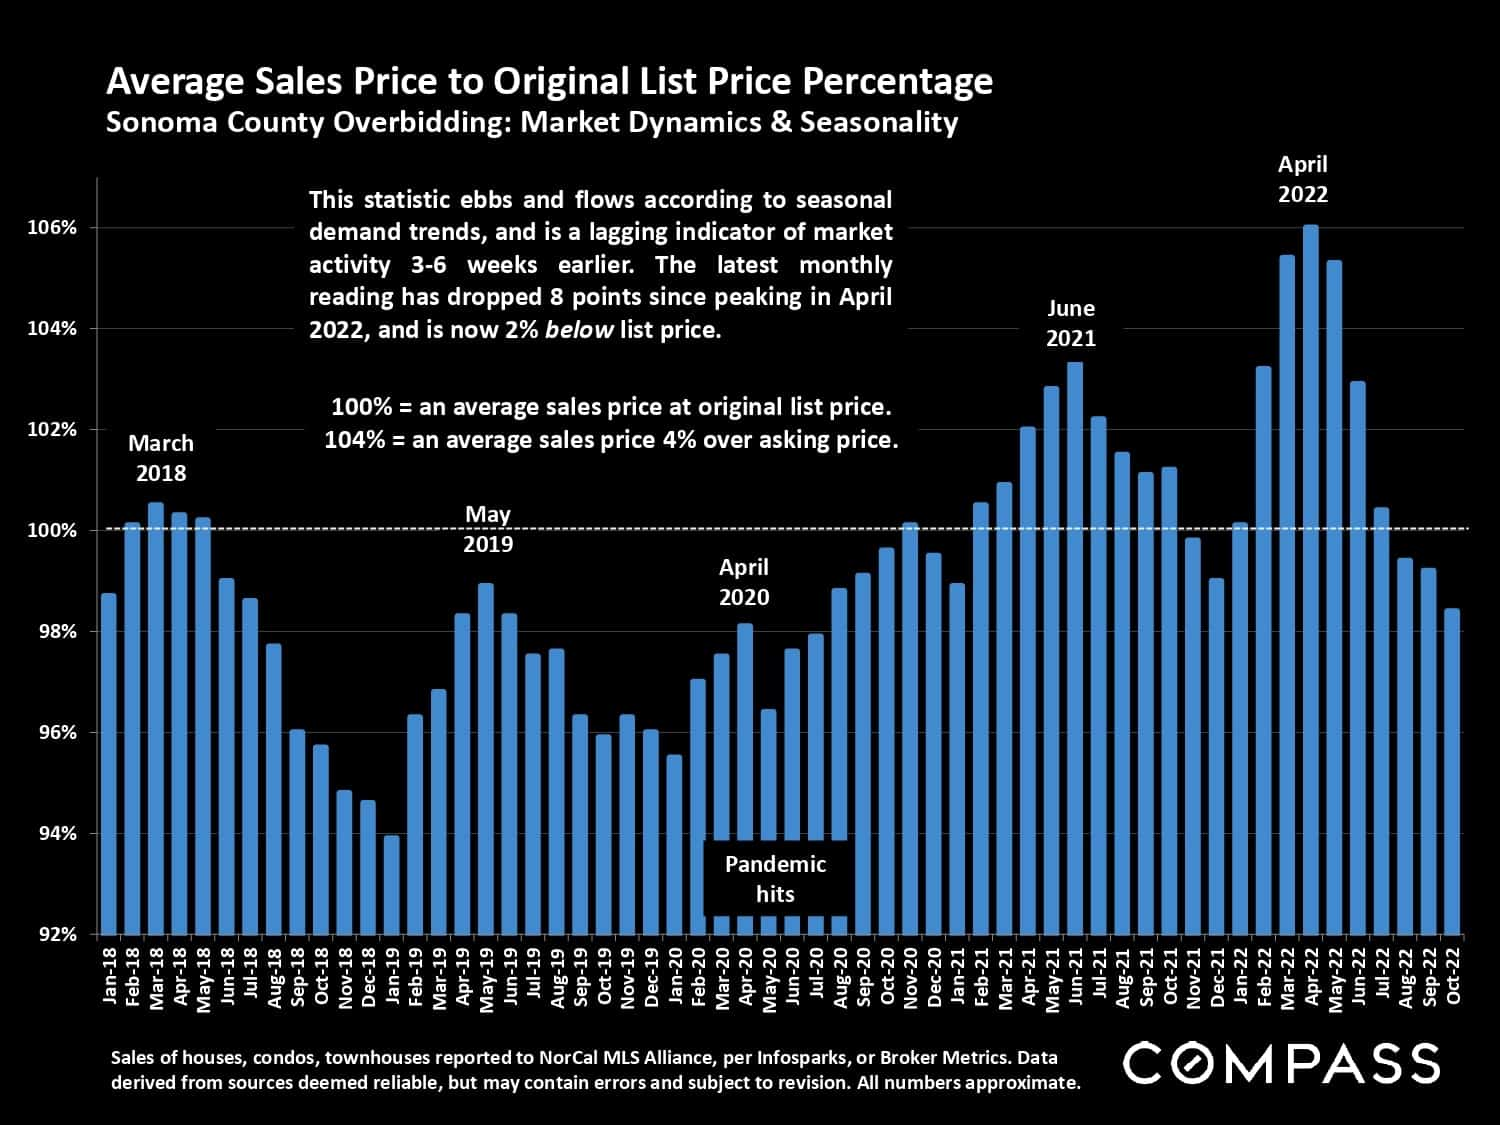
Sonoma County sales-to-list price chart, January 2018 to October 2022, peaking above 106% in April 2022.

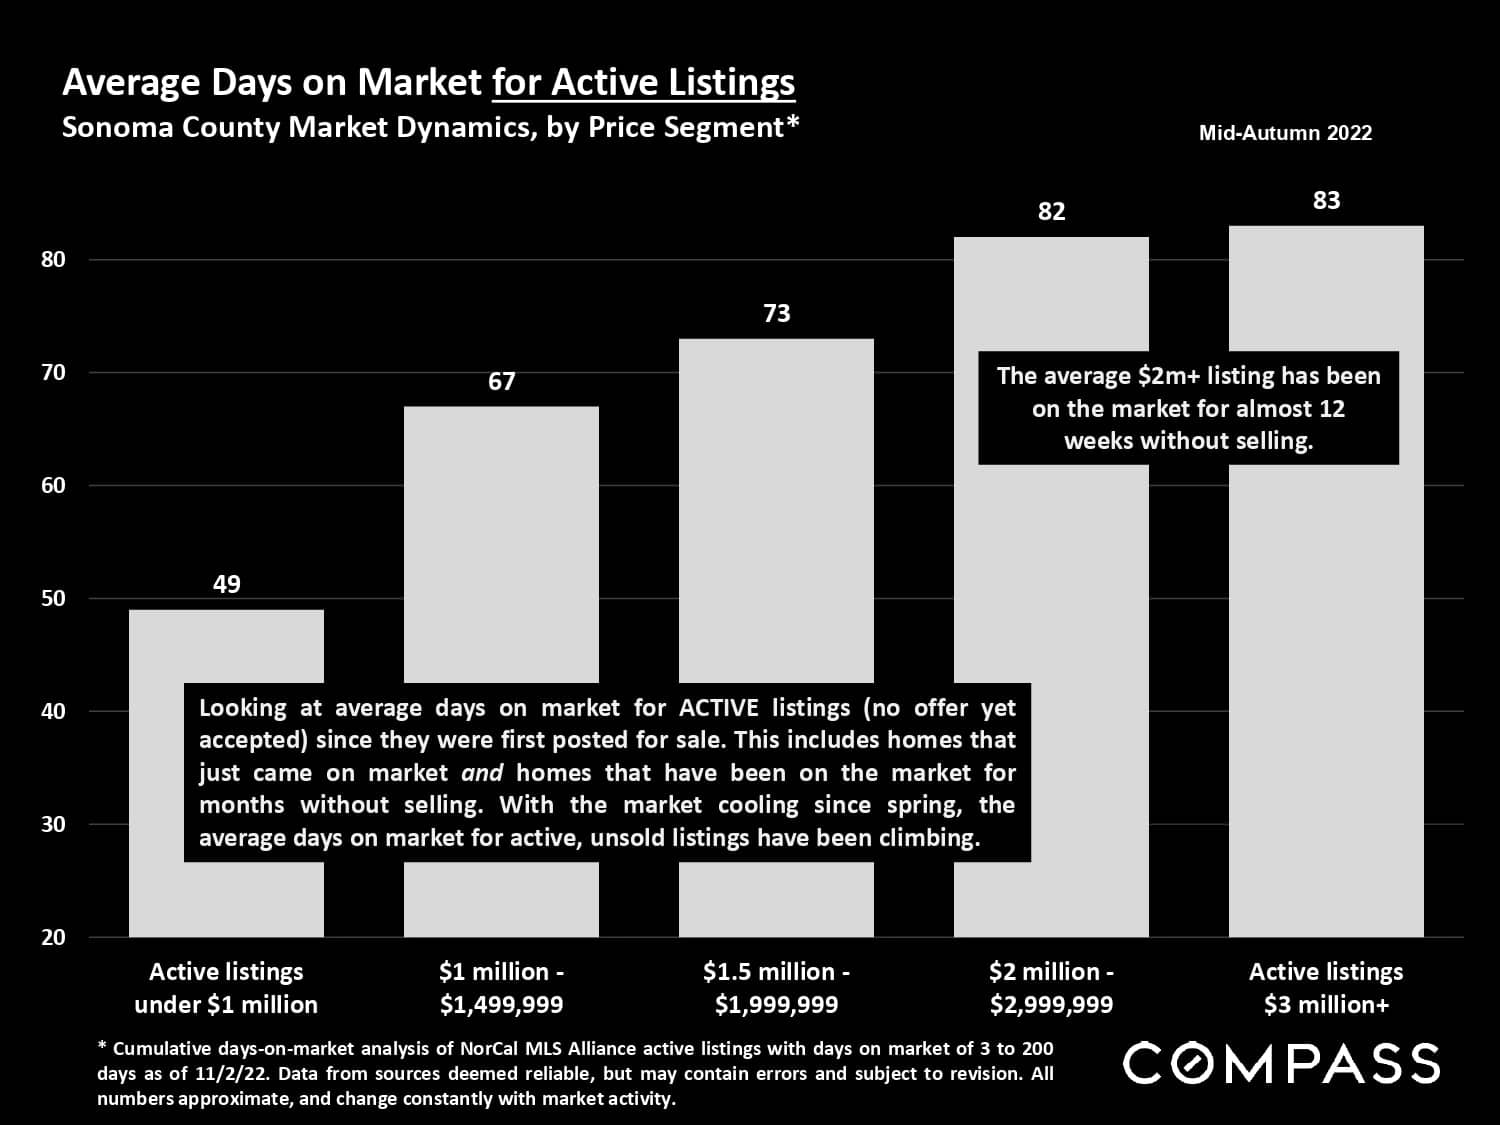
Chart of Sonoma County active listings’ average days on market by price segment, ranging from 49 to 83 days.

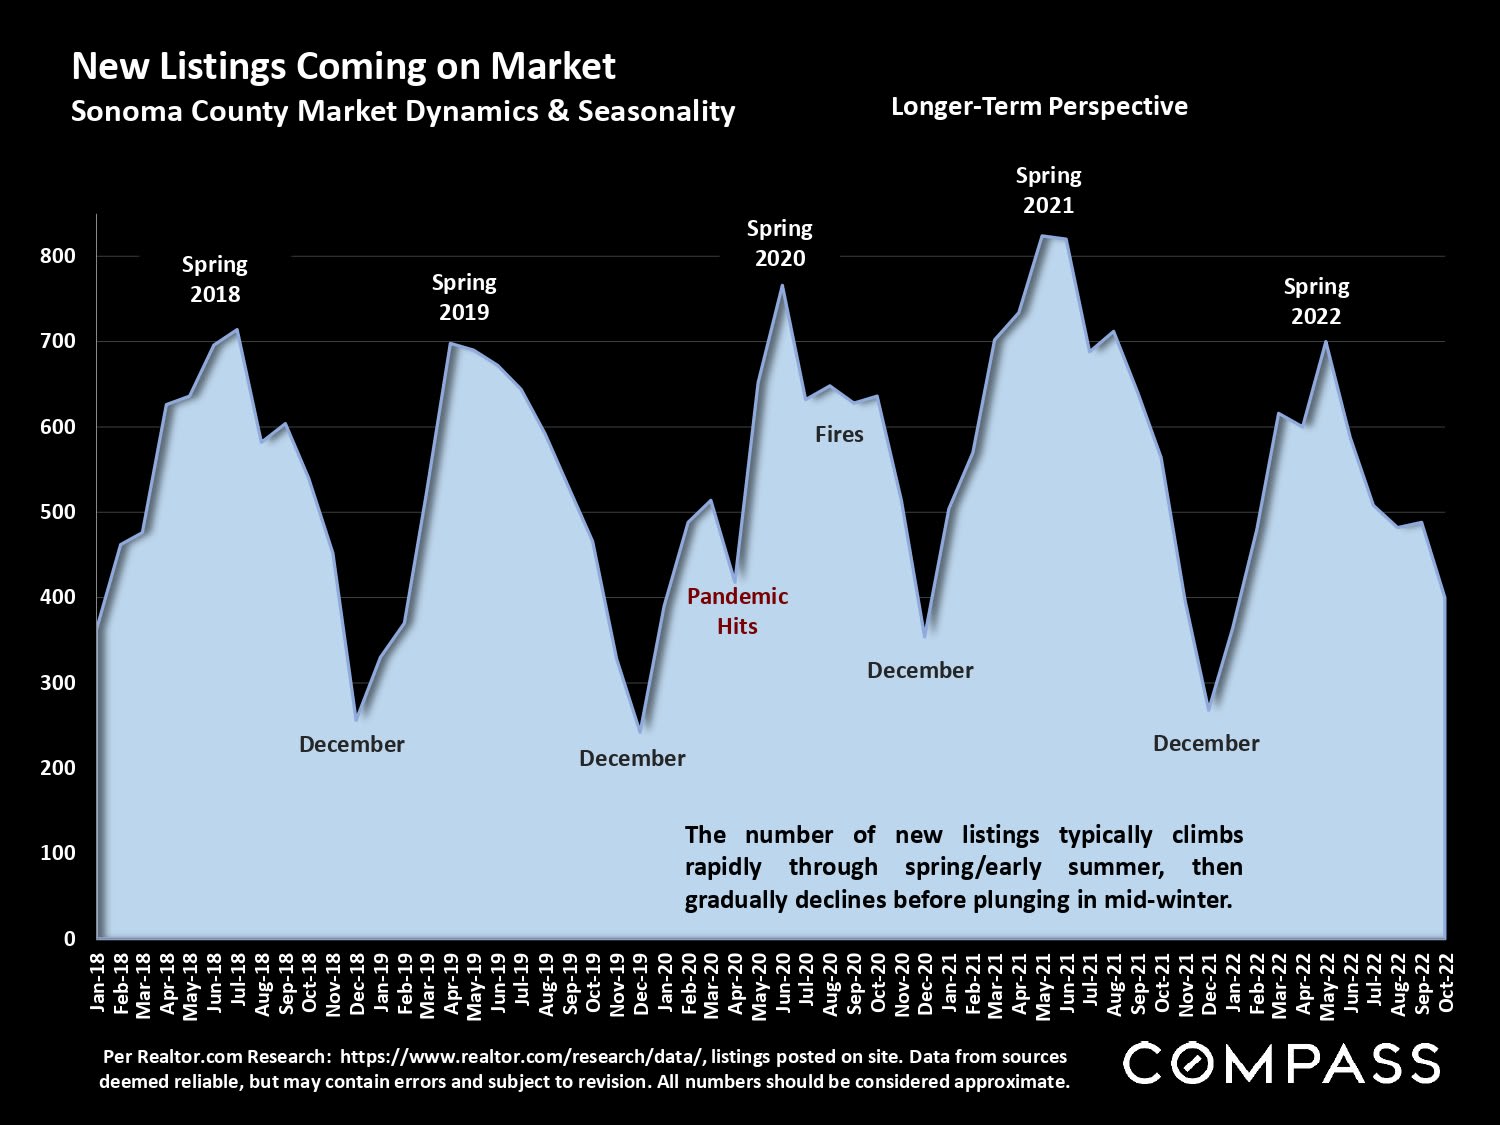
Chart of Sonoma County new listings from 2018 to 2022, showing seasonal spring peaks and winter declines.

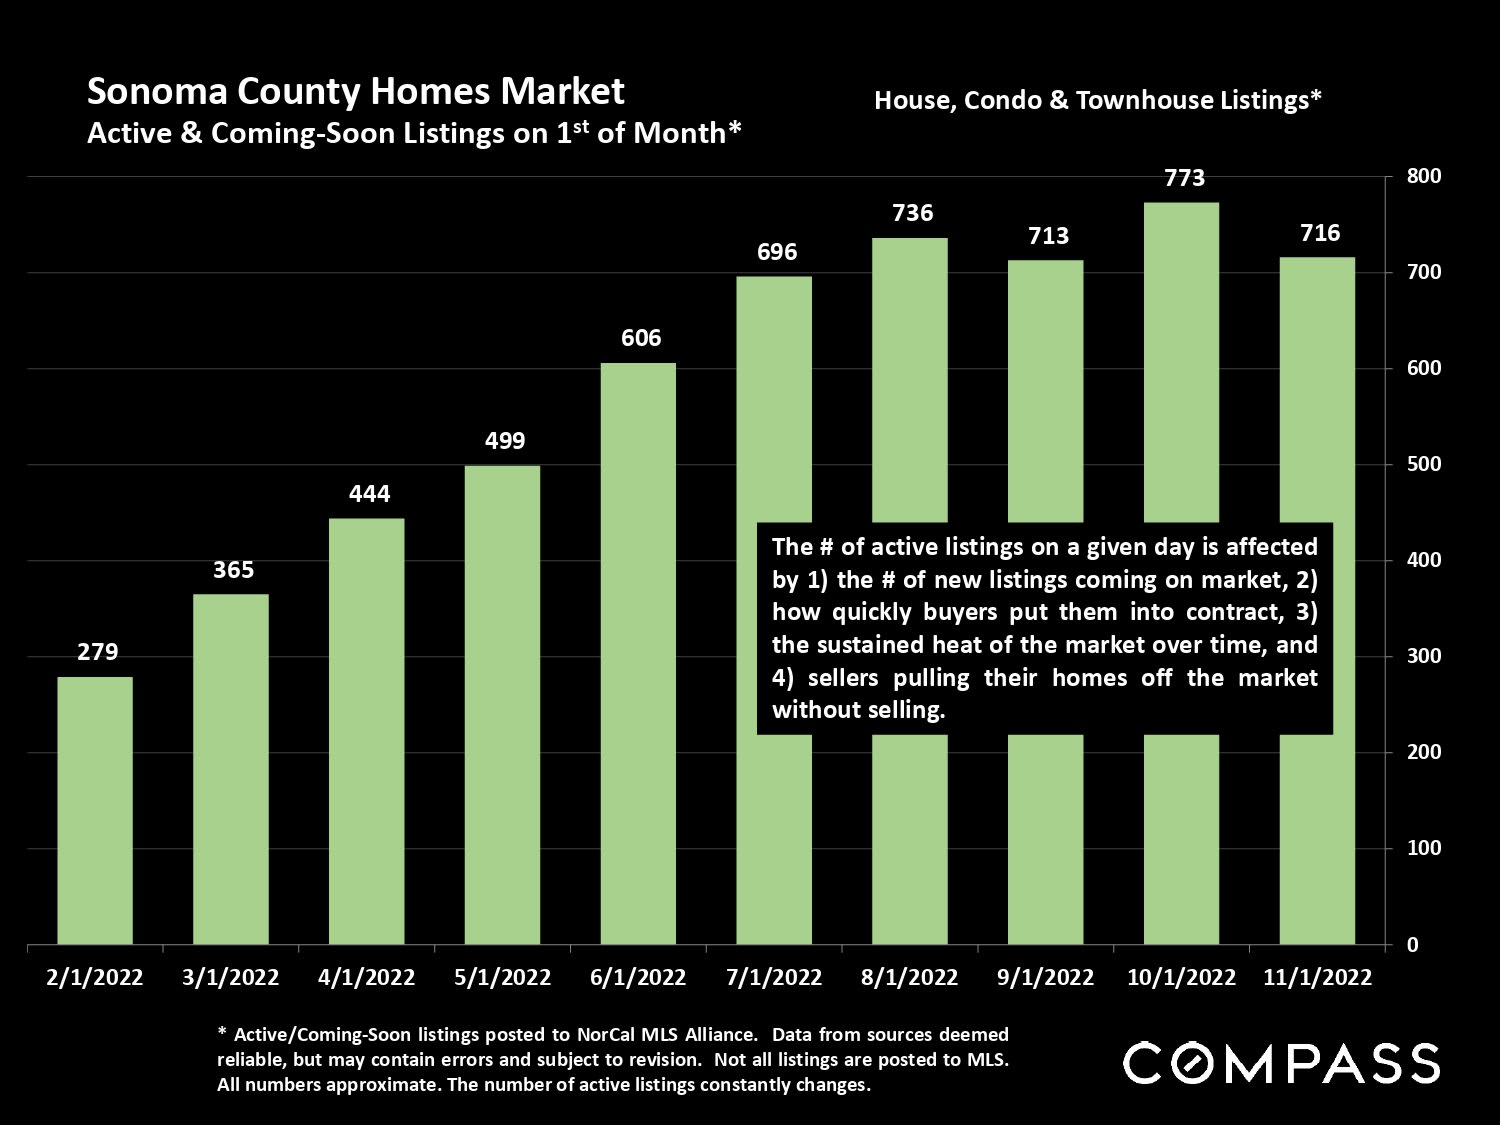
Chart of Sonoma County active and coming-soon listings, rising from 279 in February to 773 in October 2022.

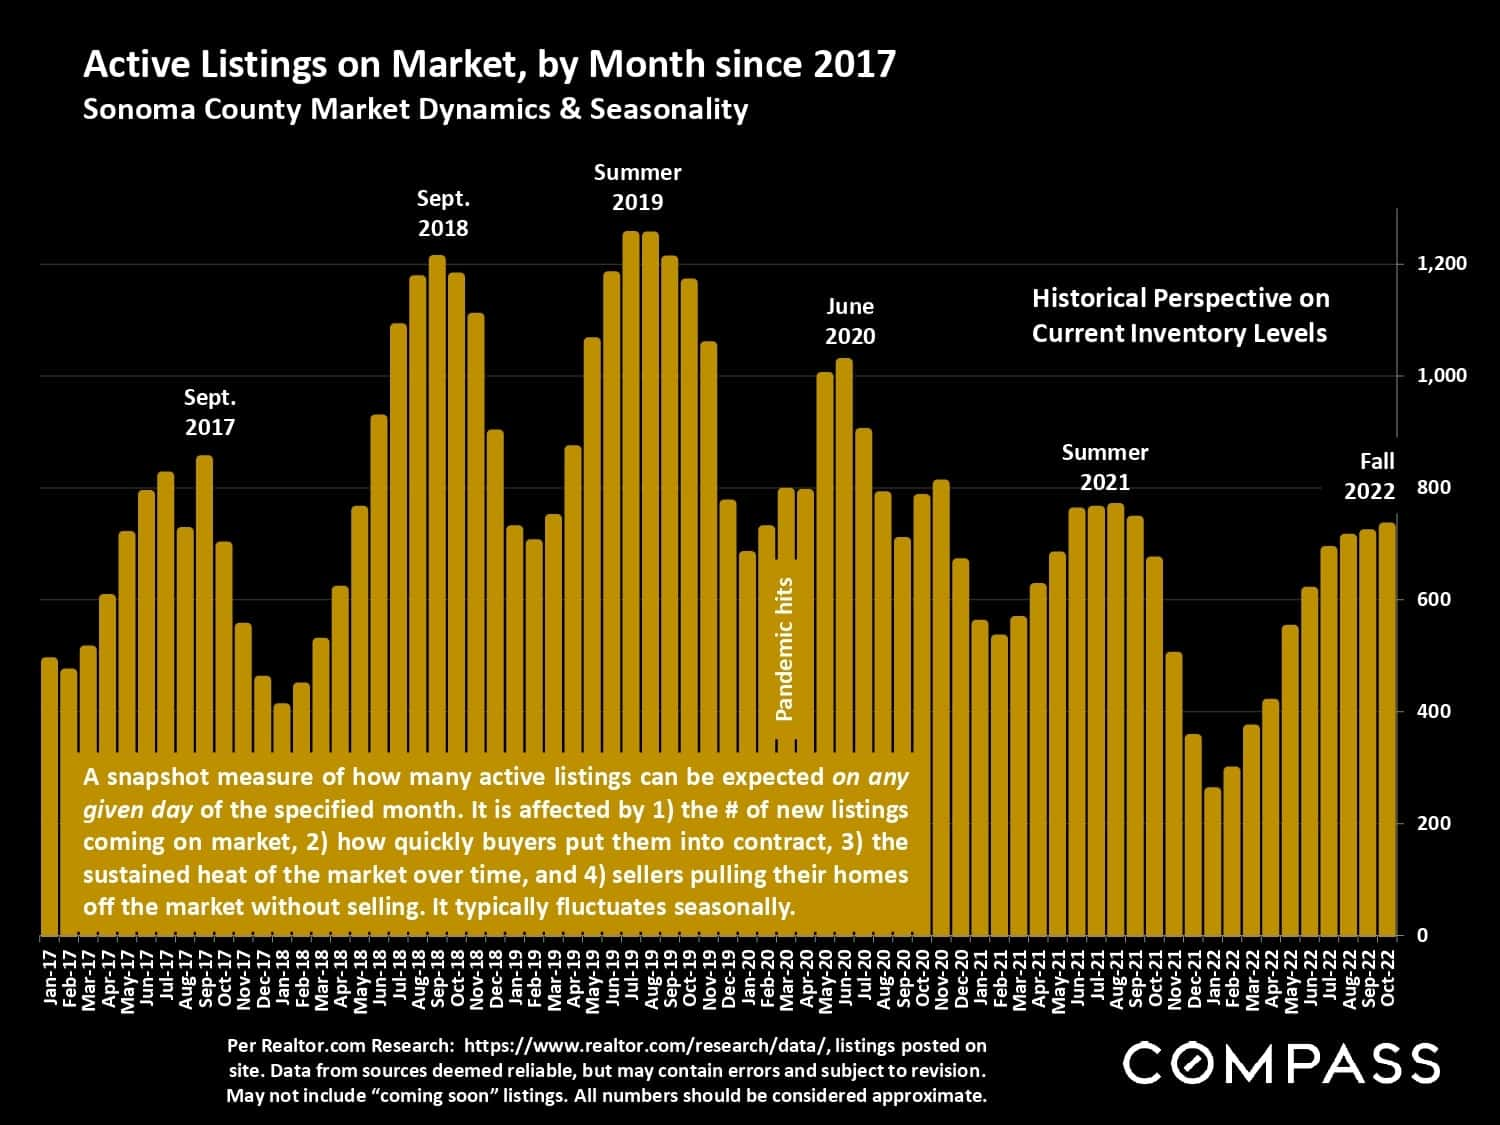
Chart of Sonoma County active listings by month, 2017–2022, showing seasonal inventory trends and a fall 2022 increase.

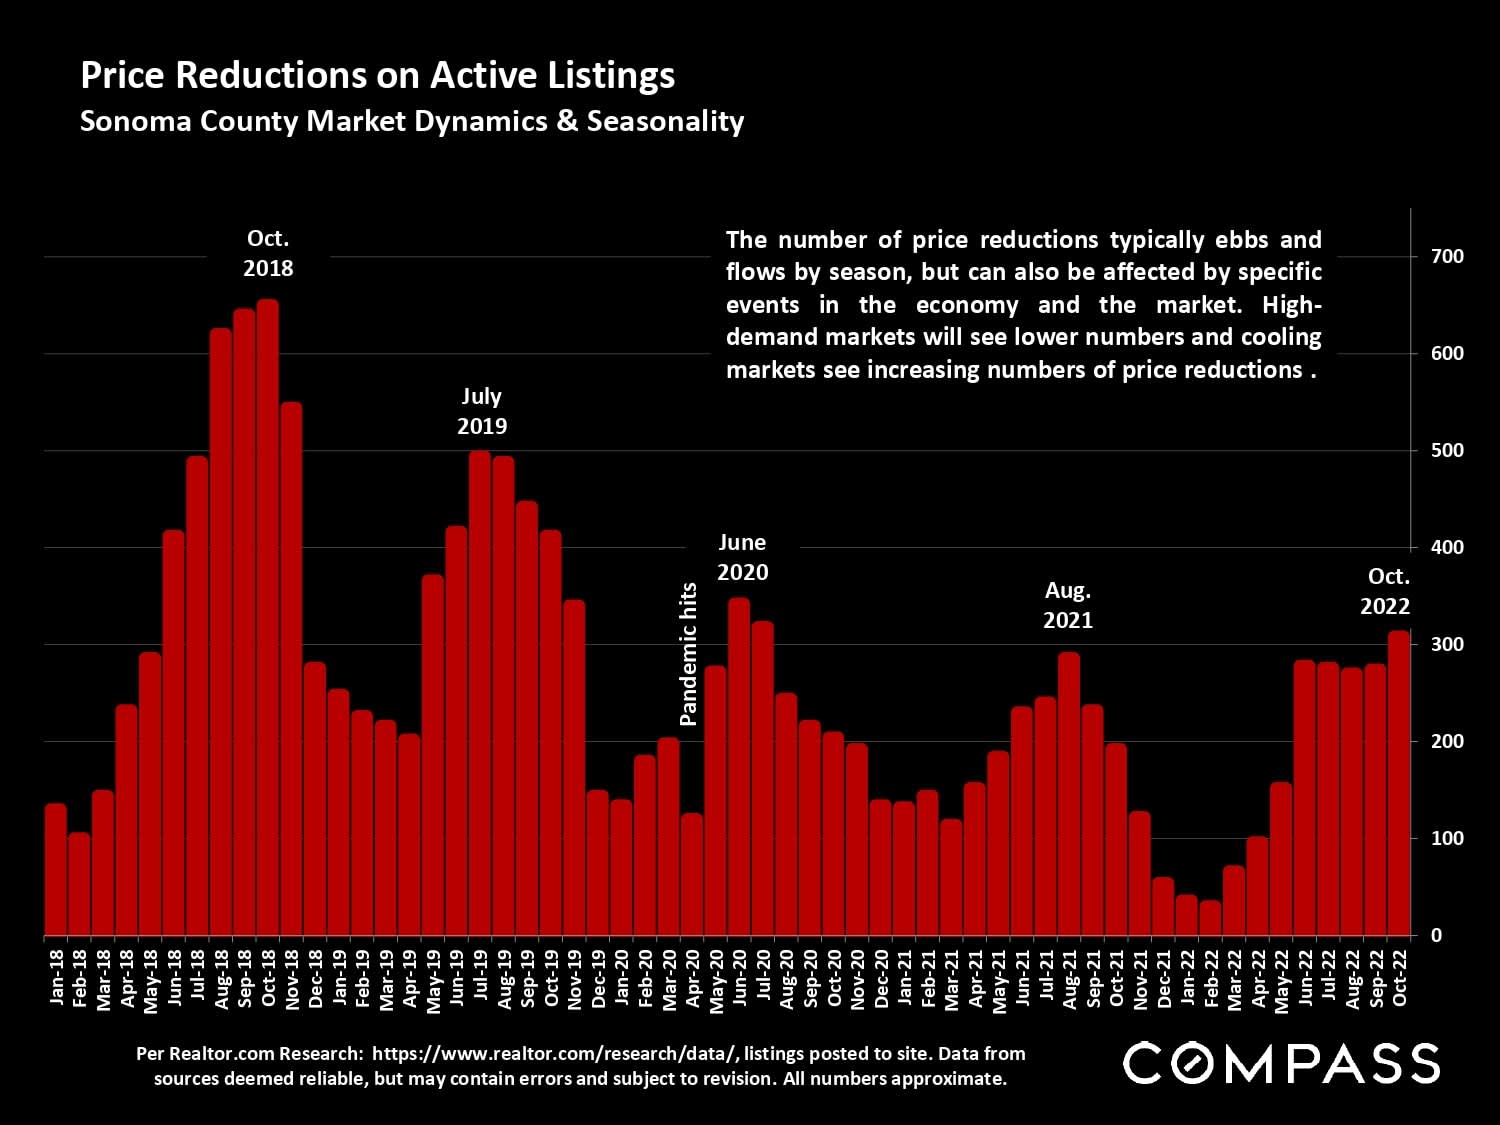
Chart of active listing price reductions from 2018 to 2022, peaking in October 2018 and rising again in late 2022.

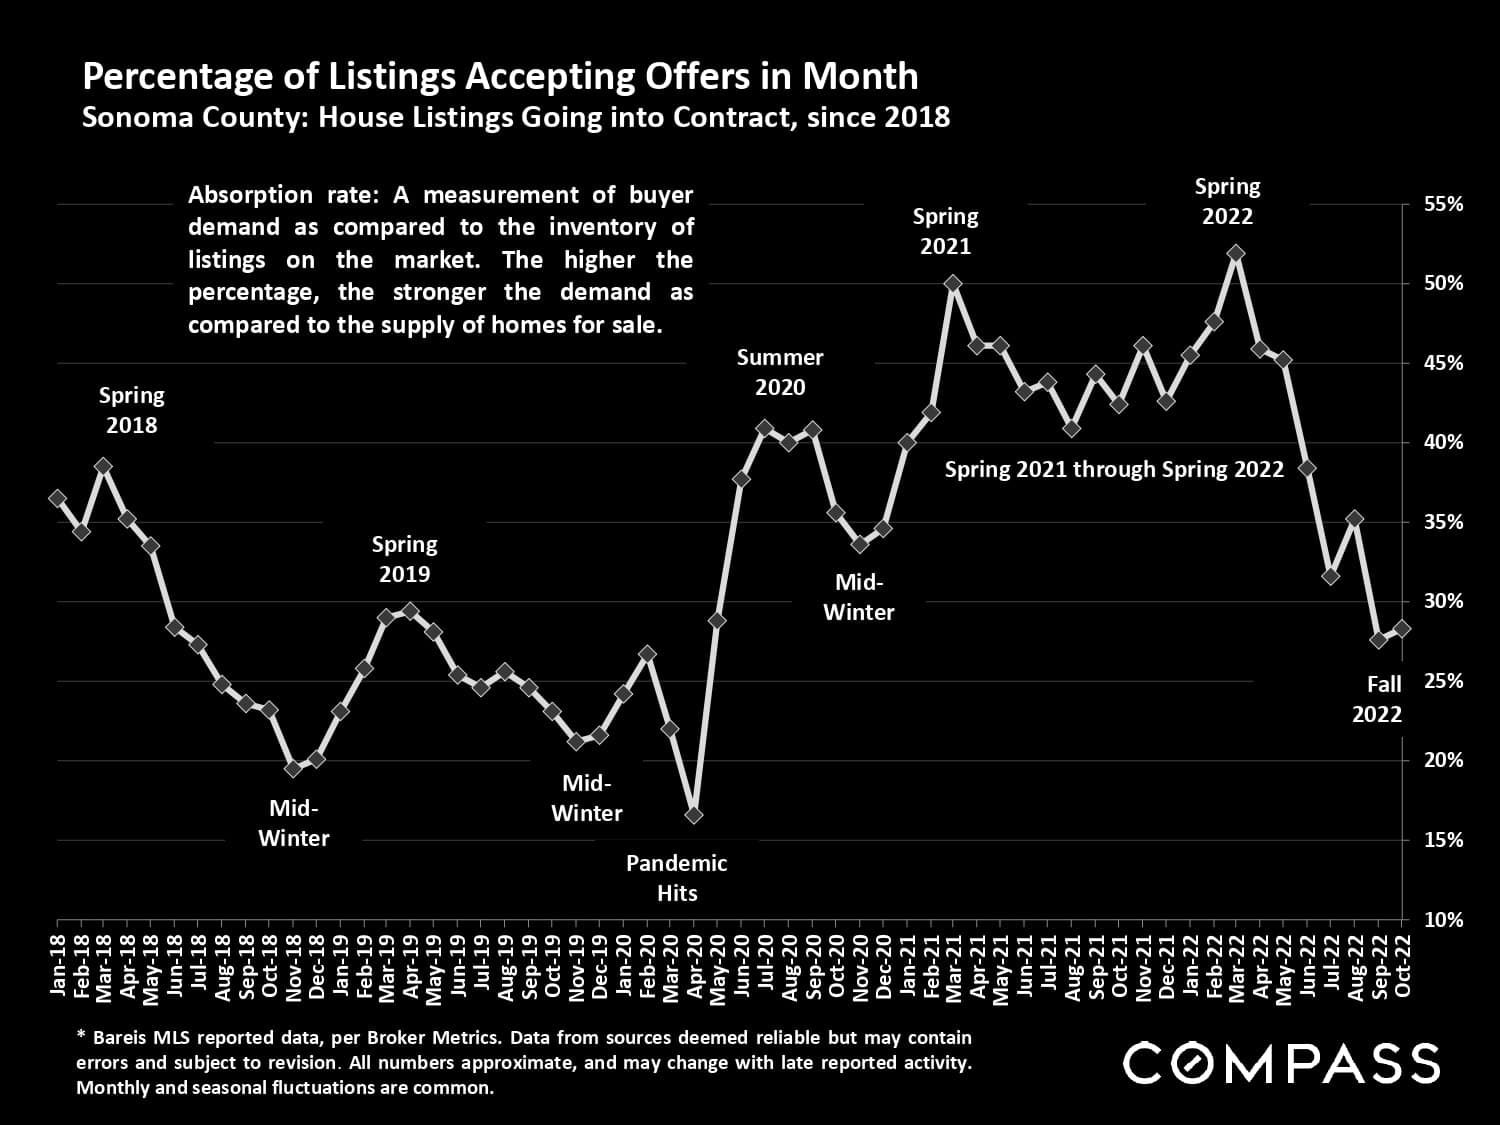
Sonoma County chart of listings accepting offers, showing a sharp decline from spring 2022 to fall 2022.

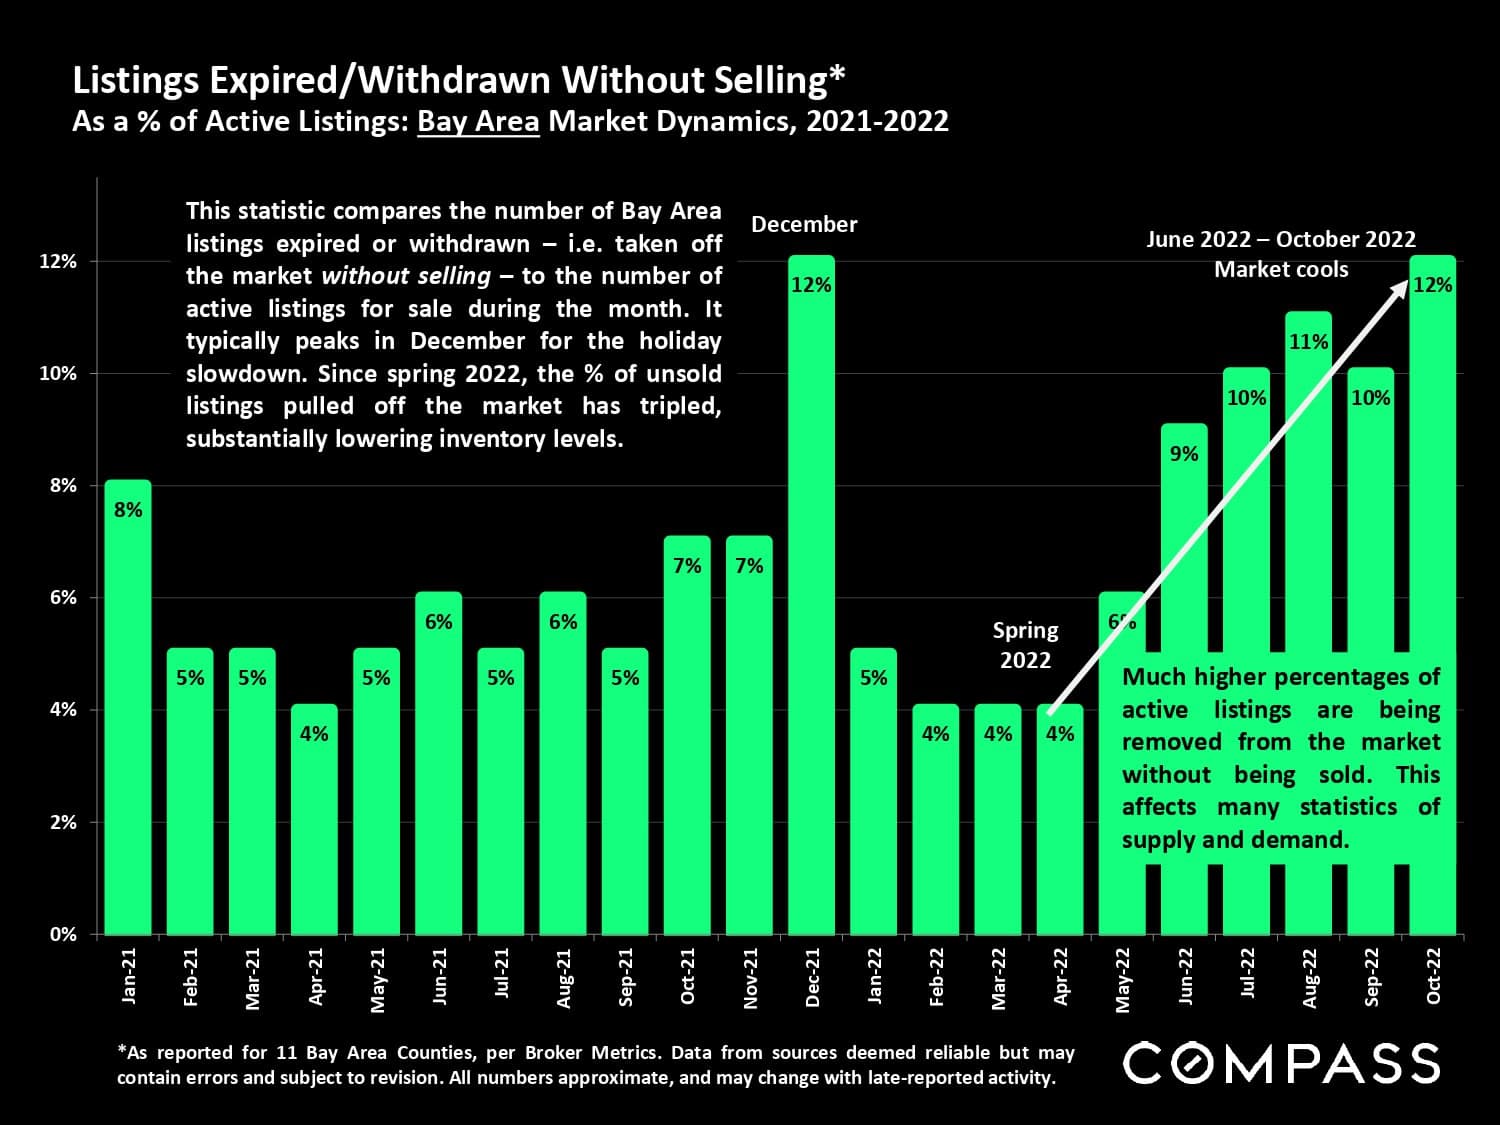
Chart of Bay Area listings withdrawn or expired without selling, rising to 12% in October 2022.

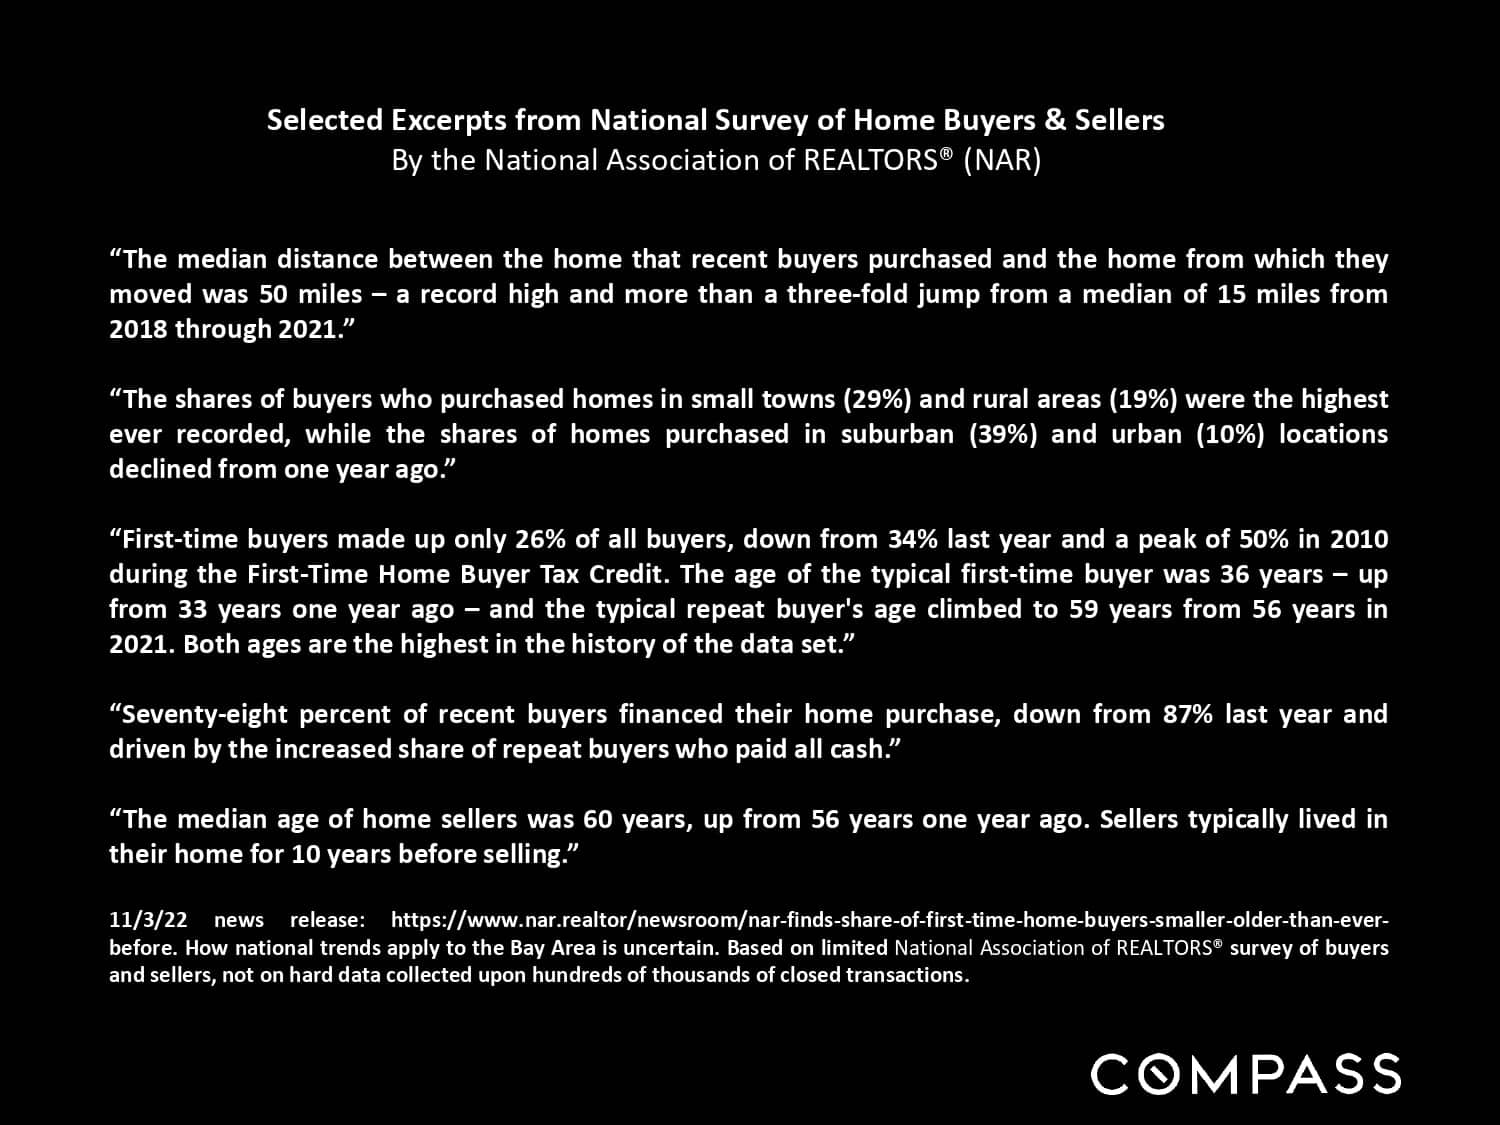
National home buyer and seller survey excerpts on moving distances, buyer demographics, financing, and seller tenure.

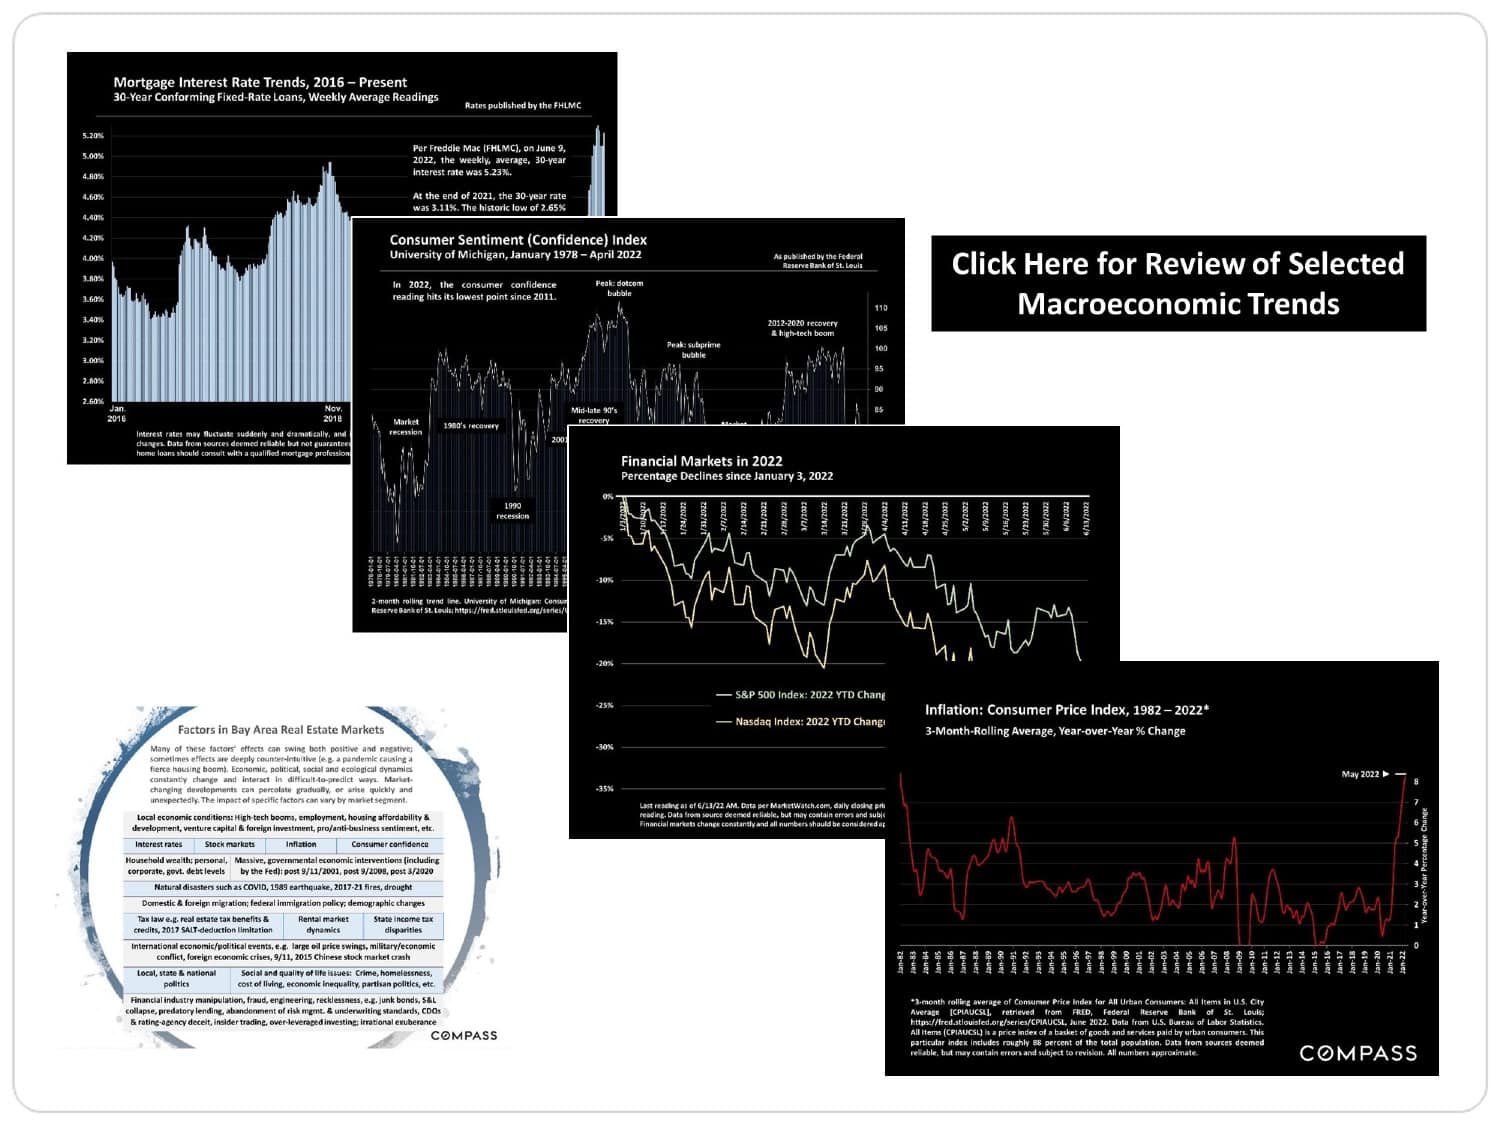
Macroeconomic charts of mortgage rates, consumer sentiment, financial markets, inflation, and Bay Area real estate factors.

San Francisco Bay Area Real Estate Survey report graphic with a Golden Gate Bridge panorama and Compass branding.

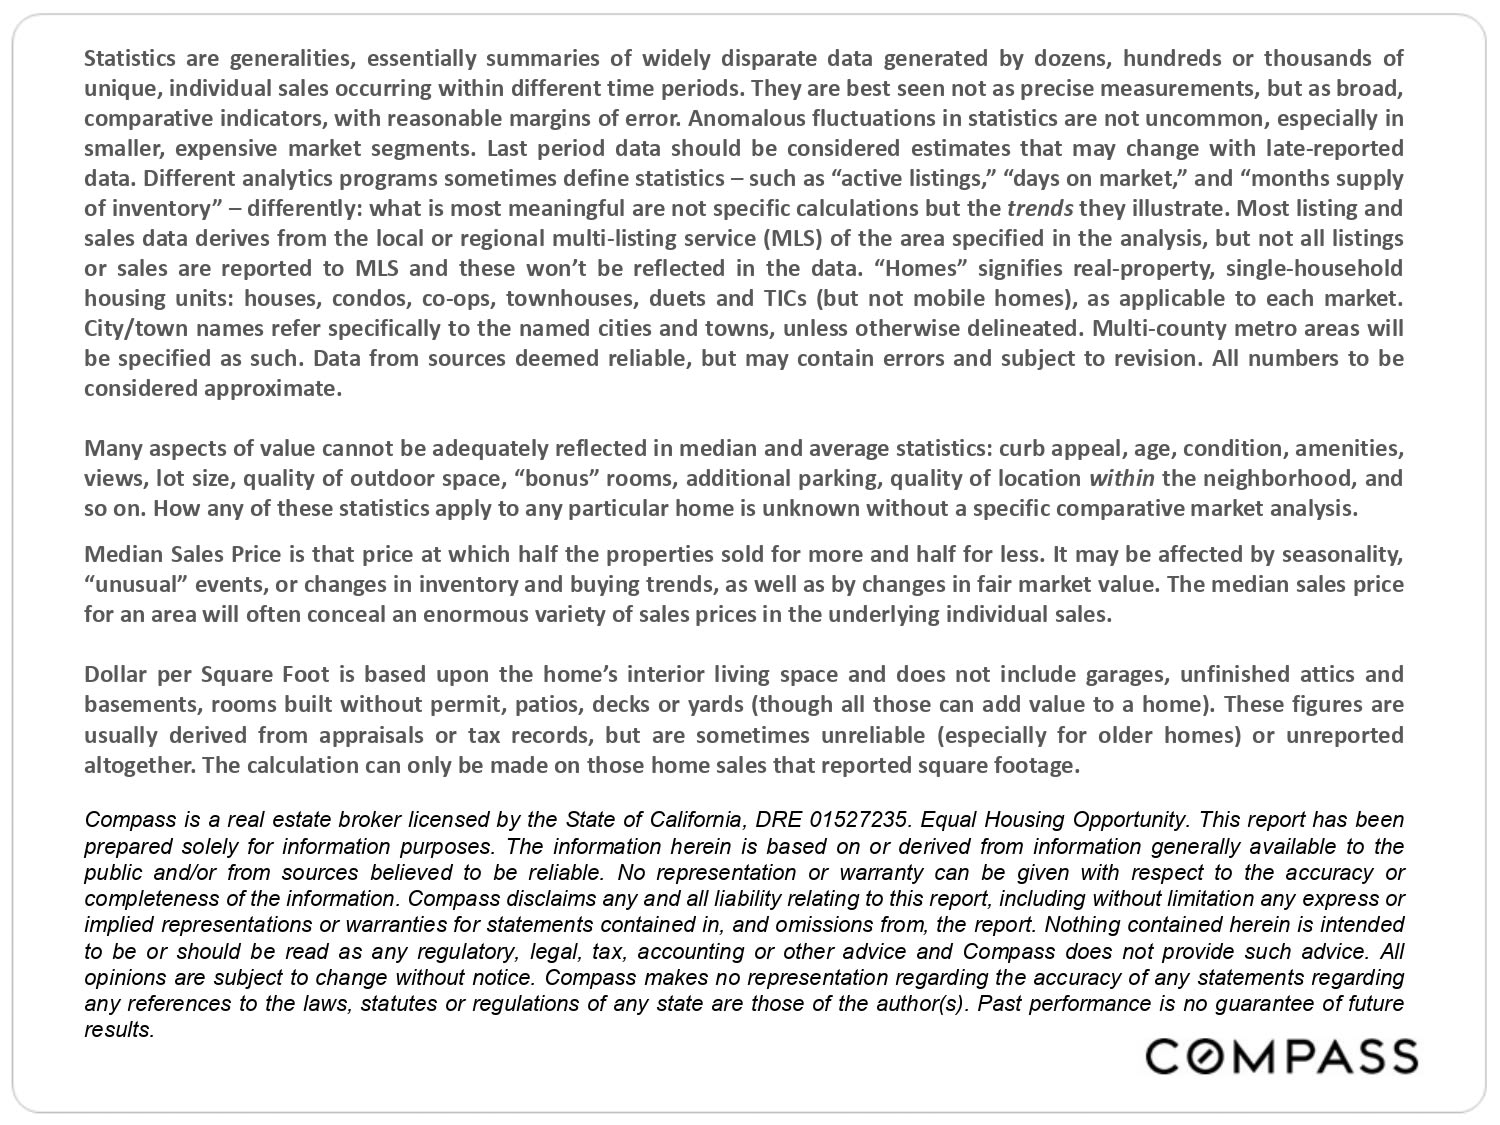
Real estate report methodology notes and Compass legal disclaimer.


View More Homes for Sale in Sonoma, Healdsburg, Sebastopol and More

Home Search

Work With Me

My commitment to ethical representation and depth of experience are the foundation of my success.
Contact Me

Follow Us on Instagram